Estimating the Area Under a Graph (VCE SSCE Mathematical Methods): Revision Notes
Estimating the Area Under a Graph
Introduction
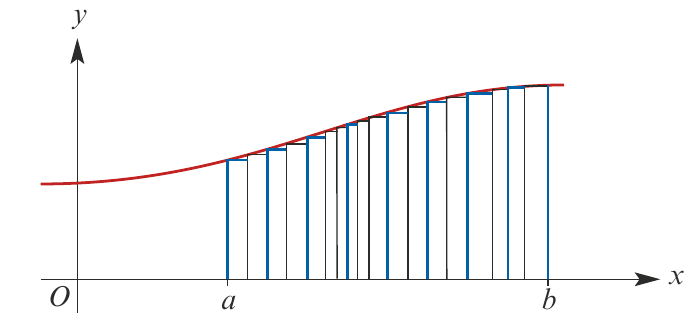
When we want to find the area between a curve and the -axis, we need methods to estimate this area. For now, we assume the function lies entirely above the -axis. We choose left and right endpoints on the -axis and estimate the area between those points.
Throughout these notes, we work with functions that lie completely above the -axis. This assumption simplifies our initial understanding of area estimation methods.
There are three main methods for estimating areas under curves:
- Left-endpoint method
- Right-endpoint method
- Trapezium rule
The trapezium rule is particularly important for VCE Mathematical Methods students, as it provides the most accurate approximation of these three methods.
The left-endpoint method
This method divides the region under the curve into rectangles. The height of each rectangle is determined by the function value at the left edge of the rectangle.
How it works
Consider the function between and . We can divide this region into rectangles, each with width units.
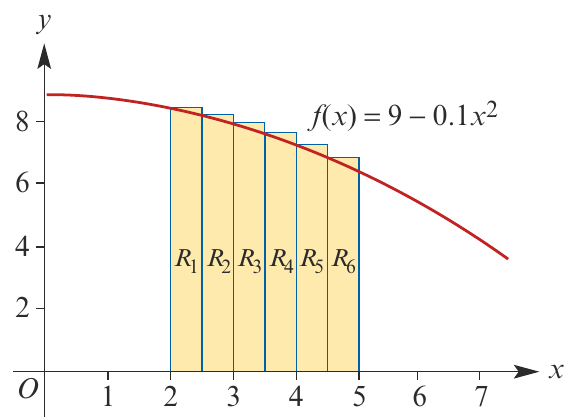
Worked Example: Calculating the Left-Endpoint Estimate
For between and with rectangles of width :
To find the total area, we calculate the area of each rectangle and add them together:
Total area = square units
This total is the left-endpoint estimate for the area under the graph.
Accuracy of left-endpoint estimates
The accuracy depends on whether the function is increasing or decreasing. Understanding this relationship helps you determine whether your estimate is an overestimate or underestimate of the true area.
Key Relationship for Left-Endpoint Estimates:
- For a decreasing function: the left-endpoint estimate is larger than the true area (overestimate)
- For an increasing function: the left-endpoint estimate is smaller than the true area (underestimate)
Remember: "Decreasing? Left is Larger"
The right-endpoint method
This method is similar to the left-endpoint method, but uses the function value at the right edge of each rectangle to determine its height.
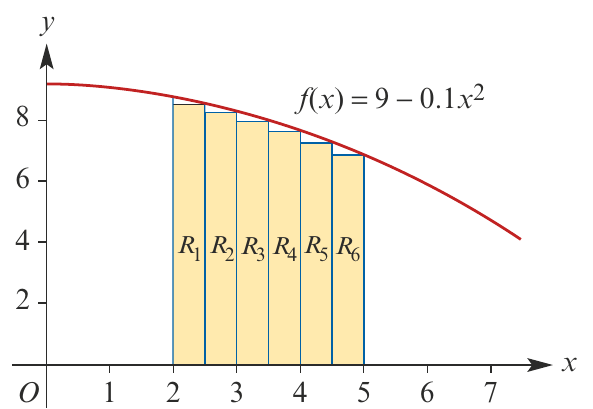
Worked Example: Calculating the Right-Endpoint Estimate
Using the same function with rectangles of width :
Total area = square units
This is the right-endpoint estimate for the area.
Comparing the estimates
The relationship between left-endpoint and right-endpoint estimates depends on whether the function is increasing or decreasing over the interval.
General Relationships:
For decreasing over :
For increasing over :
Remember: "Increasing? Right is higher"
The trapezium rule
The trapezium rule provides a more accurate approximation by using trapeziums instead of rectangles. A trapezium is a quadrilateral with one pair of parallel sides.
Area of a trapezium
The formula for the area of a trapezium is:
where and are the lengths of the parallel sides and is the perpendicular distance between them.
Think of the trapezium formula as "half times the sum of parallel sides times height" - this helps you remember that we're averaging the two parallel sides.
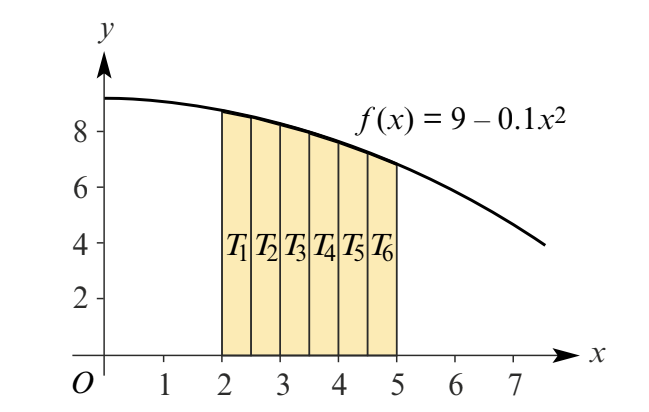
Applying the trapezium rule
Using the same function between and , we divide the region into trapeziums of width :
Total area = 23.0875 square units
This is the trapezium estimate for the area under the graph.
Alternative trapezium formula
The trapezium estimate can also be calculated using:
Notice that the first and last function values appear once, while all intermediate values are multiplied by 2. This pattern makes the trapezium rule easier to apply for many subdivisions.
Key properties of the trapezium rule
The trapezium rule has several important properties that make it particularly useful for area estimation.
Trapezium Estimate as an Average:
The trapezium estimate is the average of the left-endpoint and right-endpoint estimates.
Remember: "TRAP averages the ENDS"
This means:
Improving Accuracy:
Using narrower strips gives a more accurate estimate. While this is time-consuming by hand, calculators and computers can handle many subdivisions quickly, providing highly accurate approximations.
Worked example: trapezium rule
Worked Example: Applying the Trapezium Rule
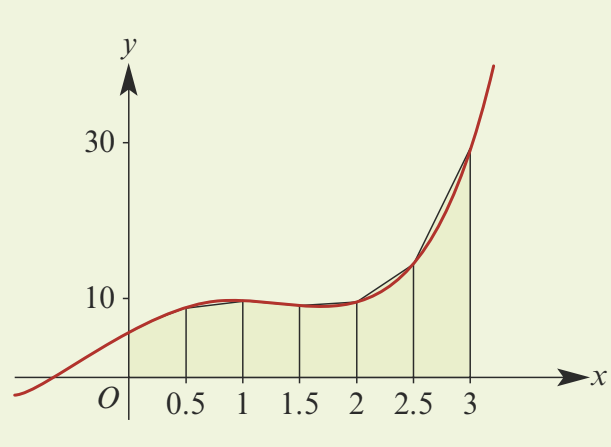
Find the sum of the areas of the shaded trapeziums to approximate the area under the graph of
between and .
Solution:
We apply the trapezium rule with trapeziums of width :
The approximate area is 35.84 square units (to 2 decimal places).
The definite integral
As we make the width of our rectangles or trapeziums smaller and smaller, our approximation becomes increasingly accurate. In the limit, as the width approaches zero, we obtain the exact area under the curve.
Formal definition
When is a continuous function and is positive for all in the interval , the area under the curve from to is called the definite integral of from to .
We write this as:
Understanding the Notation:
The definite integral notation contains several important components:
- is called the integrand
- is the lower limit of the integral
- is the upper limit of the integral
- The symbol represents integration
- indicates we are integrating with respect to
Trapezium rule and the definite integral
The trapezium rule provides an approximation to the definite integral. This connection shows how our estimation methods relate to the exact mathematical definition of area.
General Trapezium Rule Formula:
where the interval is divided into equal subintervals.
As increases (narrower strips), the approximation becomes more accurate.
Using geometric methods
For linear functions or piecewise-linear functions, we can find exact areas using geometric formulas for triangles and trapeziums. This approach is faster and more accurate than numerical approximation methods when applicable.
Worked example: geometric methods
Worked Example: Evaluating Definite Integrals Using Geometry
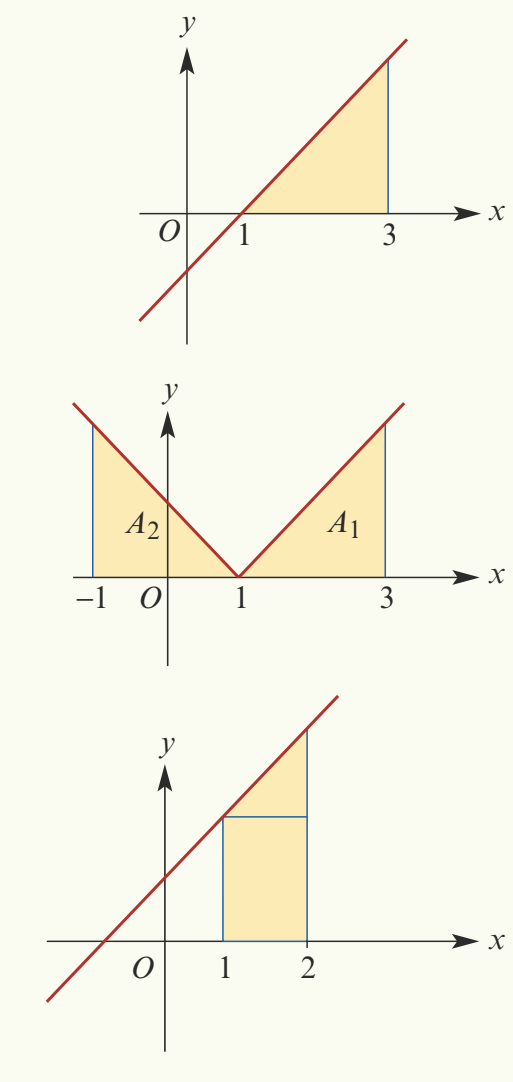
Evaluate each of the following using area formulas:
a)
b)
c)
Solution:
a) The graph of forms a triangle.
Area of triangle:
Therefore
b) The region consists of two triangular areas.
Area:
Therefore
c) The required region is a trapezium.
Area:
Therefore
Important note about signs
All examples in this note consider regions above the -axis. When a region lies below the -axis, the area is assigned a negative value by convention. The trapezium rule can still be applied in these cases.
Remember!
Key Points to Remember:
-
Three estimation methods: Left-endpoint, right-endpoint, and trapezium rule are used to approximate areas under curves.
-
Accuracy depends on the function: For decreasing functions, left-endpoint overestimates and right-endpoint underestimates. For increasing functions, the opposite is true.
-
Trapezium rule is most accurate: The trapezium estimate equals the average of the two endpoint estimates and generally provides better accuracy than either endpoint method alone.
-
Definite integral notation: represents the exact area under the curve from to .
-
Geometric shortcuts: For linear and piecewise-linear functions, use geometric formulas (triangles, trapeziums) to find exact areas quickly without numerical approximation.
-
Narrower strips improve accuracy: Using more subdivisions with smaller widths produces better approximations to the true area.