Quadratic Functions (VCE SSCE Mathematical Methods): Revision Notes
Quadratic Functions
Introduction
Quadratic functions are polynomial functions of degree . They can be expressed in different forms, and understanding how to work with these forms is essential for graphing and solving quadratic equations.
Transformations of parabolas
The basic parabola has the equation . We can transform this basic shape using dilations and translations to create any quadratic function.
Dilation from the x-axis
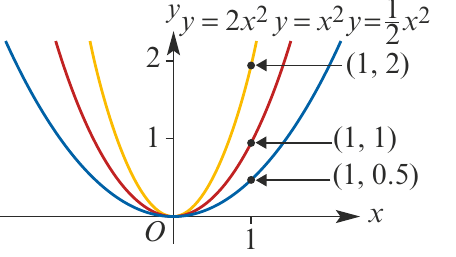
When we have a positive value of , the graph of is obtained from the basic parabola by stretching or compressing it vertically.
- If , the parabola becomes narrower (vertical stretch)
- If , the parabola becomes wider (vertical compression)
- The larger the value of , the steeper the parabola
For example, comparing and with shows how the dilation factor affects the width of the parabola.
Translation parallel to the x-axis
Horizontal translations shift the parabola left or right without changing its shape.
-
When , the graph of is obtained by moving exactly units to the left (in the negative x-direction)
-
When , the graph of moves units to the right (in the positive x-direction)
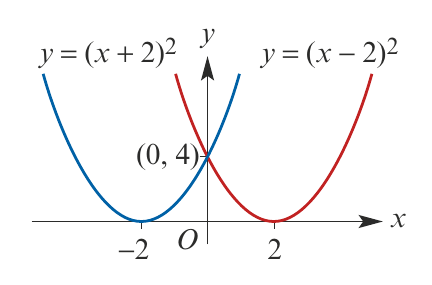
This might seem counterintuitive at first. Remember: shifts the graph units left, whilst shifts it units right. The sign inside the parentheses is opposite to the direction of the shift.
Translation parallel to the y-axis
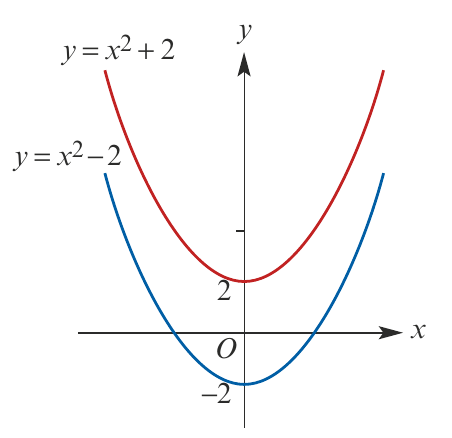
Vertical translations shift the parabola up or down.
-
When , the graph of moves units upward (in the positive y-direction)
-
When , the graph of moves units downward (in the negative y-direction)
Combinations of transformations
We can apply multiple transformations to create more complex quadratic functions. The general turning point form is , which represents:
-
A dilation by factor from the x-axis
-
A horizontal translation of units
-
A vertical translation of units
Transformation Sequence
For , the transformations are applied as follows:
- Start with
- Dilate by factor from the x-axis
- Translate units in the positive x-direction (right)
- Translate units in the positive y-direction (up)
Graphing quadratics in turning point form
The turning point form of a quadratic is . This form immediately reveals important features of the graph.
Key features:
- The vertex (turning point) is located at
- The axis of symmetry is the vertical line
- If , the parabola opens upward and has a minimum point at the vertex
- If , the parabola opens downward and has a maximum point at the vertex
- The value of determines how narrow or wide the parabola is
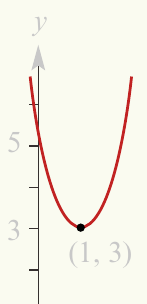
Worked Example: Sketching
From the equation, we can identify:
- The vertex is at
- The axis of symmetry is
- Since , the parabola opens upward and has a minimum point
- The graph is narrower than because
- The range is
To find the y-axis intercept, substitute :
To find the x-axis intercepts, set :
Since we cannot take the square root of a negative number, this equation has no real solutions. Therefore, the graph has no x-axis intercepts. This makes sense because the minimum value is , which is above the x-axis.
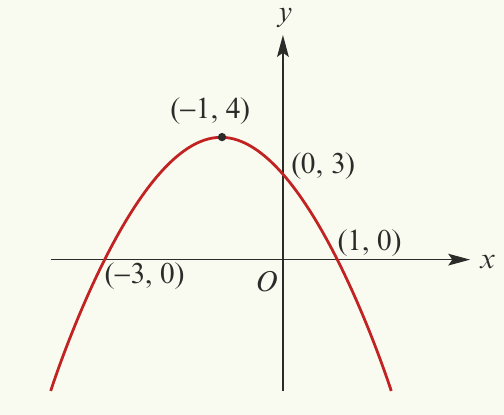
Worked Example: Sketching
From the equation:
- The vertex is at
- The axis of symmetry is
- Since , the parabola opens downward and has a maximum point
Finding the y-axis intercept (when ):
Finding the x-axis intercepts (when ):
The x-axis intercepts are and .
The axis of symmetry
For a quadratic function in polynomial form , the axis of symmetry has the equation:
This formula is extremely useful. The x-coordinate of the turning point is . To find the y-coordinate, substitute this x-value back into the quadratic equation.
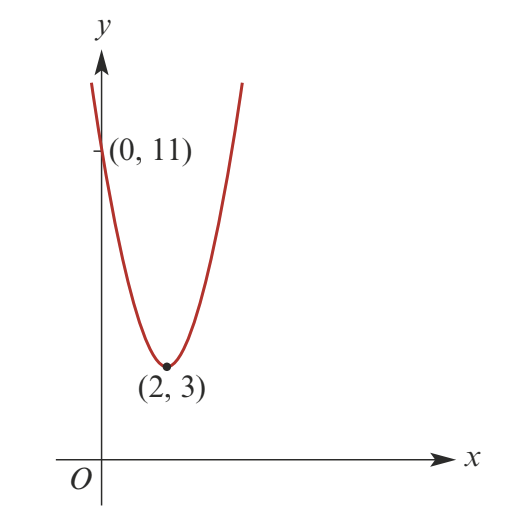
Worked Example: Finding the Turning Point
For the function , find the turning point and express in turning point form. State the minimum value and range.
Here and , so the axis of symmetry is:
When :
The turning point is .
In turning point form:
Since , the parabola has a minimum point.
The minimum value is and the range is .
Worked Example: Finding the Maximum
For the function , find the turning point and express in turning point form. State the maximum value and range.
Here and , so:
When :
The turning point is .
In turning point form:
Since , the parabola has a maximum point.
The maximum value is and the range is .
Graphing quadratics in polynomial form
When a quadratic is in polynomial form , we can sketch its graph by finding key features.
Steps for graphing:
Step 1: Find the y-axis intercept (this is simply )
Step 2: Find the x-axis intercepts by solving
Step 3: Find the axis of symmetry using
Step 4: Find the turning point coordinates
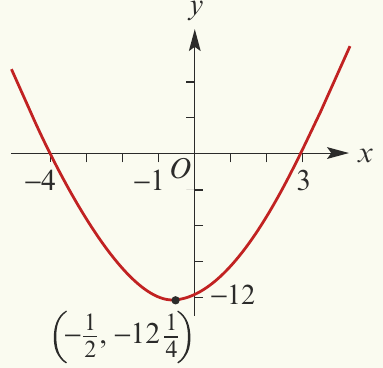
Worked Example: Graphing from Polynomial Form
Find the intercepts and turning point for , then sketch the graph.
Step 1: The y-axis intercept is
Step 2: To find x-axis intercepts, solve :
Step 3: The axis of symmetry is:
Step 4: When :
The turning point is .
Completing the square
Completing the square is a technique for converting a quadratic from polynomial form to turning point form. This process reveals the vertex and makes graphing easier.
For :
Take half the coefficient of (which is ), then add and subtract its square .
For :
First factor out , then complete the square inside the brackets.
Worked Example: Completing the Square
Write in turning point form by completing the square, then sketch the graph.
(add and subtract )
Now we can find the x-axis intercepts:
Key features:
- y-axis intercept:
- Turning point:
- x-axis intercepts: and
The quadratic formula
The solutions to the quadratic equation (where ) are given by the quadratic formula:
This formula always works, even when the quadratic doesn't factorise easily. Notice that the axis of symmetry formula comes from the quadratic formula (it's the midpoint between the two solutions).
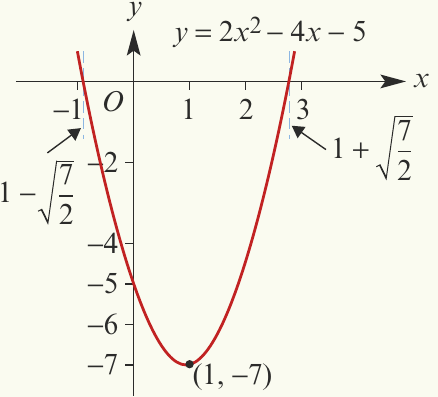
Worked Example: Using the Quadratic Formula
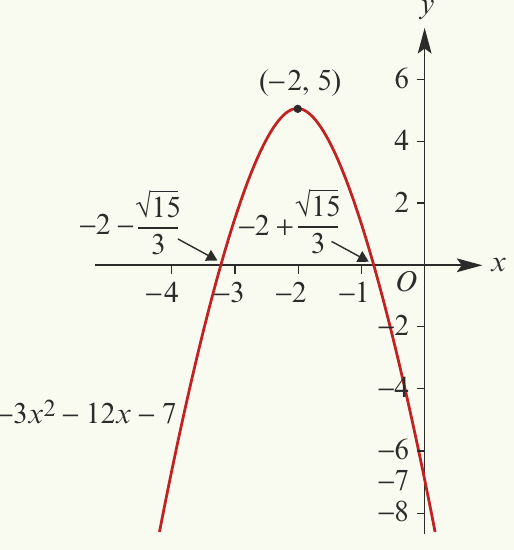
Sketch the graph of by finding the axis of symmetry, turning point, and using the quadratic formula to find x-axis intercepts.
The y-axis intercept is .
Axis of symmetry:
Turning point:
When :
The turning point is .
x-axis intercepts:
Using the quadratic formula:
So the x-intercepts are and .
The discriminant
The discriminant of a quadratic polynomial is:
The discriminant tells us how many real solutions the equation has, which corresponds to the number of x-axis intercepts on the graph.
Interpreting the discriminant:
- If : two distinct real solutions (graph crosses x-axis twice)
- If : one repeated real solution (graph touches x-axis once)
- If : no real solutions (graph does not intersect x-axis)
For rational coefficients:
- If is a perfect square and : two rational solutions
- If : one rational solution
- If is not a perfect square and : two irrational solutions
Worked Example: Analyzing X-Axis Intersections
Without sketching, determine whether the graph of each function crosses, touches, or does not intersect the x-axis:
a)
Here , ,
Since , the graph crosses the x-axis twice.
b)
Here , ,
Since , the graph touches the x-axis once.
c)
Here , ,
Since , the graph does not intersect the x-axis.
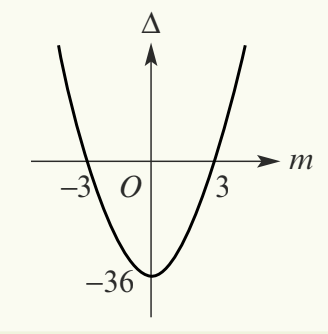
Worked Example: Finding Parameter Values
Find the values of for which has:
a) one solution
b) no solution
c) two distinct solutions
For the quadratic , the discriminant is:
a) One solution:
b) No solution:
c) Two distinct solutions:
Key Points to Remember:
- Turning point form shows the vertex directly and whether the parabola opens up () or down ()
- Axis of symmetry for is always
- Completing the square converts polynomial form to turning point form by adding and subtracting
- Quadratic formula finds x-intercepts for any quadratic
- Discriminant determines the number of solutions: (two solutions), (one solution), (no real solutions)