Graphing Quadratics (VCE SSCE Mathematical Methods): Revision Notes
Graphing Quadratics
Introduction to quadratic functions
A quadratic function is a mathematical relationship where the highest power of the variable is 2. Quadratics can be written in two main forms:
Polynomial form:
where , and are constants and .
Turning point form:
Both forms describe the same type of graph, called a parabola. The turning point form is particularly useful for graphing because it immediately tells us where the vertex is located and how the graph has been transformed from the basic parabola .
The basic parabola
The simplest quadratic function is . Let's look at its key features by first creating a table of values.
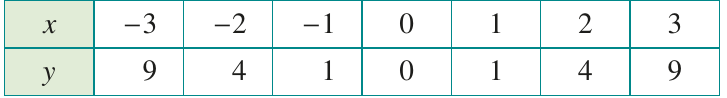
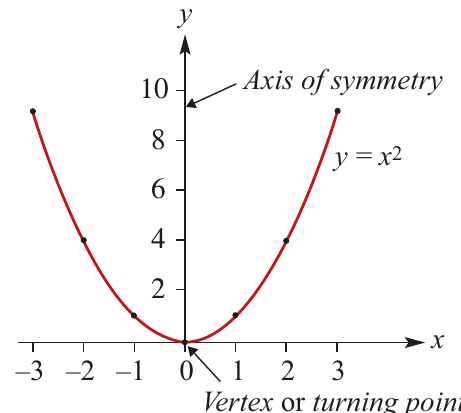
When we plot these points and connect them with a smooth curve, we get a U-shaped graph called a parabola.
Key features of
The graph of has several important characteristics:
-
Shape: The graph is called a parabola and has a smooth, curved U-shape.
-
Vertex (turning point): The lowest point on the graph is at the origin . This is where the parabola changes direction.
-
Axis of symmetry: The parabola is perfectly symmetrical about the -axis (the line ). If you folded the graph along this line, both halves would match exactly.
-
Range: All -values are positive or zero. The minimum value of is , occurring at the vertex.
-
Direction: The parabola opens upward.
Transformations of
We can transform the basic parabola by changing the values in the equation. These transformations help us graph any quadratic function.
Effect of the coefficient
When we change the coefficient in , we affect the width and direction of the parabola.
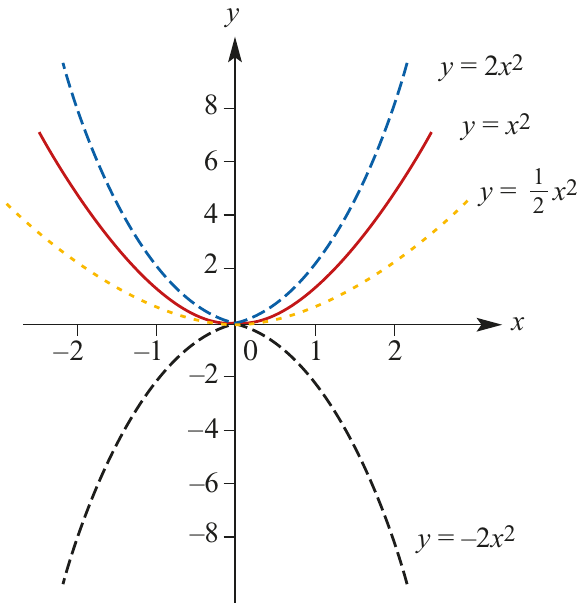
When : The parabola becomes narrower (steeper) than . For example, is narrower than . This is called a dilation of factor from the -axis.
When : The parabola becomes broader (wider) than . For example, is broader than .
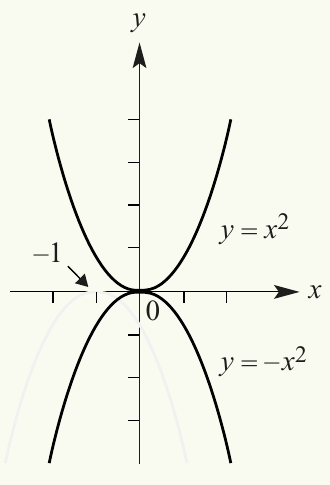
When is negative: The parabola is reflected in the -axis, meaning it opens downward instead of upward. For example, is an upside-down parabola. This is called a reflection in the x-axis.
All these graphs still have their vertex at the origin and are symmetric about the -axis.
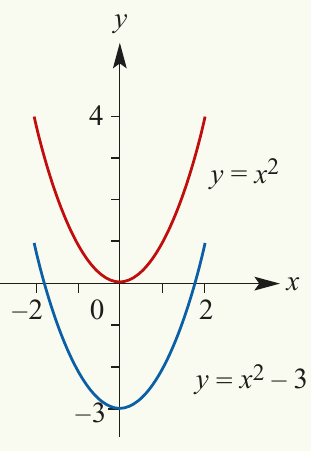
Vertical translations (changing )
Adding or subtracting a constant to the function moves the parabola up or down.
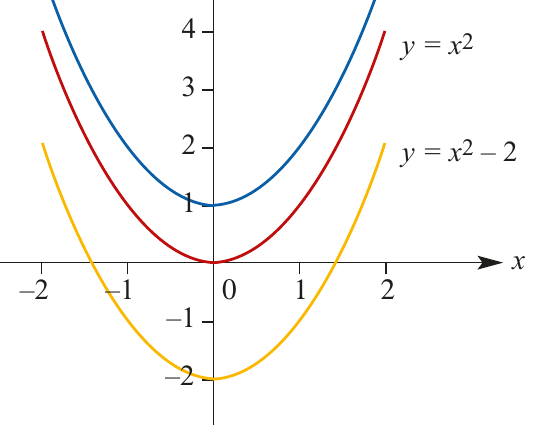
For the function :
- When : The graph shifts k units upward. For example, has its vertex at .
- When : The graph shifts |k| units downward. For example, has its vertex at .
The axis of symmetry remains the -axis (the line ), but the range changes. For , the minimum value is instead of .
Horizontal translations (changing )
Changing in the function moves the parabola left or right.
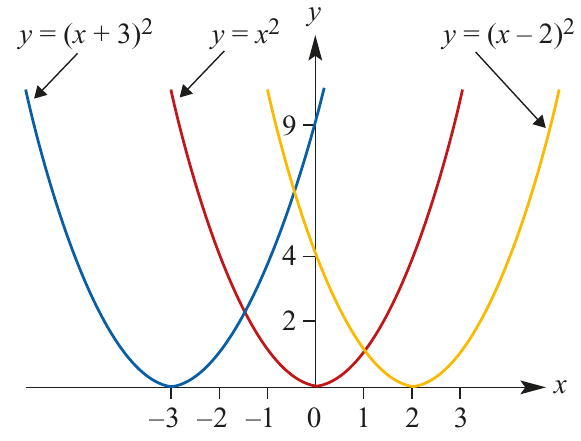
For the function :
- When : The graph shifts h units to the right. For example, has its vertex at and axis of symmetry at .
- When : The graph shifts |h| units to the left. For example, (which is ) has its vertex at and axis of symmetry at .
Be careful with the signs! In the form , if we have , this means , so the graph moves 3 units to the left.
Combining transformations
By combining all these transformations, we can graph any quadratic in the form .
Key properties of
Key properties:
-
Vertex: The turning point is at .
-
Axis of symmetry: The line .
-
Width and direction: Determined by the value of (same as before).
-
Congruence: The graph has exactly the same shape as , just moved to a different position.
To graph :
- Start with the graph of
- Translate it units horizontally (right if , left if )
- Translate it units vertically (up if , down if )
Finding intercepts
To add more detail to your graph, you can find where it crosses the axes.
-intercept: Set and solve for .
-intercepts: Set and solve for . Note that some parabolas don't cross the -axis at all (when the vertex is above the -axis for upward-opening parabolas, or below for downward-opening ones).
Worked examples
Worked Example: Sketching a Vertical Translation
Sketch the graph of .
Solution:
The graph of is obtained by taking the basic parabola and moving it 3 units down.
The vertex is at .
The axis of symmetry is the line (the -axis).
To find the -intercepts, set :
The -intercepts are at and .
Worked Example: Reflection and Translation
Sketch the graph of .
Solution:
This graph is obtained by starting with , reflecting it in the -axis (because of the negative sign), then moving it 1 unit to the left.
The vertex is at .
The axis of symmetry is the line .
The -intercept is at (the vertex is on the -axis).
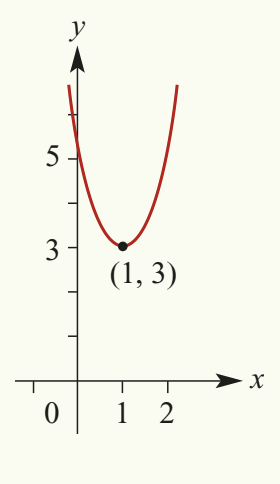
Worked Example: Combined Transformations with No x-intercepts
Sketch the graph of .
Solution:
The graph is obtained from by translating 1 unit right and 3 units up.
The vertex is at .
The axis of symmetry is the line .
The graph is narrower than because .
The range is .
Finding the -intercept:
When :
Finding the -intercepts:
The minimum value of is 3, which occurs at the vertex. Since the parabola opens upward and the vertex is above the -axis, the graph never crosses the x-axis. Therefore, there are no -intercepts.
We can verify this by setting :
Since we cannot take the square root of a negative number (in real numbers), there are no real solutions.
Worked Example: Complete Analysis of a Parabola
Sketch the graph of .
Solution:
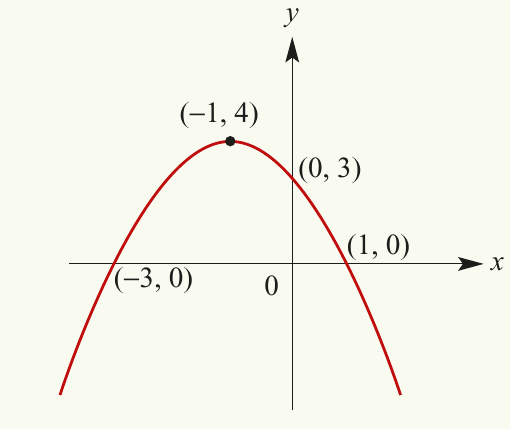
The vertex is at .
The axis of symmetry is the line .
Finding the -intercept:
When :
Finding the -intercepts:
When :
The -intercepts are at and .
Key Points to Remember:
-
The graph of is a parabola with vertex at and axis of symmetry along the -axis.
-
In the turning point form , the vertex is at (h, k) and the axis of symmetry is the line x = h.
-
The coefficient controls the width and direction: makes the parabola narrower, makes it broader, and negative flips it upside down.
-
To find the -intercept, substitute into the equation. To find -intercepts, set and solve for (note that some parabolas have no -intercepts).
-
All parabolas of the form have the same shape as , just translated to different positions.