Uses of Index Numbers (AQA A-Level Economics): Revision Notes
Uses of Index Numbers
Introduction to index numbers
Index numbers are statistical tools that economists use to track changes in economic variables over time. They provide a standardised way of measuring and comparing data across different periods.
An index number is a value used within an index system (such as the consumer prices index) to enable accurate comparisons across time periods. The key feature of index numbers is that they start from a reference point called the base year, which is assigned a value of 100.
The base year serves as the benchmark for all comparisons. By setting it at 100, any other value in the index immediately shows the percentage change from this starting point. This makes calculations and interpretations much simpler than working with raw data values.
How index numbers work
When tracking an economic variable using index numbers:
- The base year is set at 100
- If the variable increases, the index rises above 100
- If the variable decreases, the index falls below 100
Understanding Index Values:
- An index value of 105 indicates a 5% increase from the base year
- An index value of 95 indicates a 5% decrease from the base year
- An index value of 115 indicates a 15% increase from the base year
This system makes it straightforward to calculate percentage changes over time. If an index moves from 100 to 110, we know immediately that there has been a 10% increase.
Why use index numbers in economics?
Index numbers serve several important purposes in macroeconomic analysis. They are particularly valuable because they simplify complex economic data and make it easier to identify trends and patterns that might otherwise be hidden in raw figures.
Facilitating comparisons over time
By setting a common baseline (the base year at 100), index numbers allow economists to easily track how variables change across months, years or decades. This is particularly useful when dealing with variables like GDP, prices or stock market values that can vary enormously in absolute terms.
Removing the effects of inflation
Index numbers are essential for distinguishing between nominal GDP (measured at current prices) and real GDP (adjusted for inflation). Real GDP measures the actual quantity of goods and services produced by eliminating the distorting effects of price changes. This is achieved by using price indices to convert nominal values into real values.
When economists want to know if an economy has truly grown, they must account for inflation. A 5% increase in nominal GDP might look impressive, but if prices rose by 5% during the same period, there has been no real growth in the quantity of goods and services produced.
Enabling international comparisons
When comparing economic performance between countries, index numbers help standardise the data even when countries have different currencies, population sizes or economic structures.
Key uses of index numbers in macroeconomics
Measuring inflation: the consumer prices index (CPI)
The Consumer Prices Index (CPI) is one of the most important uses of index numbers. It measures changes in the price level of a representative basket of consumer goods and services over time.
The CPI is used by:
- The government to assess economic performance
- The Bank of England to guide monetary policy decisions
- Businesses to adjust wages and contracts
- Households to understand the cost of living
Related price indices:
-
Consumer Prices Index including Housing (CPIH): This extends the CPI to include housing costs for owner-occupiers (mortgage costs) and Council Tax. It is the most comprehensive measure of inflation in the UK.
-
Retail Prices Index (RPI): A long-standing measure of UK inflation that meets the required standard for designation as National Statistics. The RPI is tied to long-term contracts related to wages and savings.
Exam tip: The two main price indices on the A-Level specification are the CPI and RPI. Make sure you understand the difference between them and when each is used.
Comparing GDP and economic performance
Index numbers enable economists to compare GDP levels across different time periods. This is particularly useful when examining:
- Economic growth rates
- Living standards (GDP per capita)
- Real versus nominal GDP changes
Interpreting GDP index numbers correctly
When comparing GDP data using index numbers, it is crucial to ensure that the data series share the same base year. Consider this example:
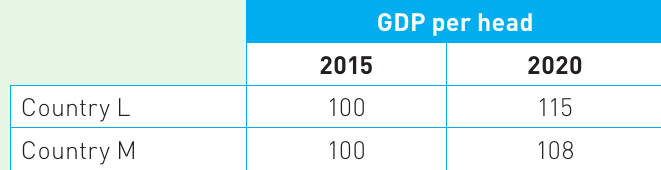
This table shows GDP per capita (head) for two countries using 2015 as the base year (both starting at 100). By 2020:
- Country L's index is 115 (15% increase)
- Country M's index is 108 (8% increase)
Important interpretation point: While we can conclude that GDP per capita grew faster in Country L (15% vs 8%), we cannot determine which country had higher absolute GDP per capita in 2020. The index numbers only tell us about percentage changes from the base year, not about absolute levels.
The same base year allows us to compare the rate of change within each country, but not to compare absolute values between countries.
Calculating real GDP using index numbers
Index numbers for inflation are used to convert nominal GDP (at current prices) into real GDP (at constant prices). Consider this example:
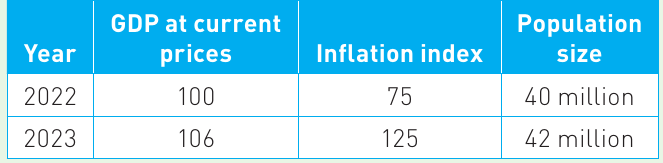
To calculate real GDP growth, economists must account for both the change in money GDP and the change in the inflation index.
From 2022 to 2023:
- Money GDP increased from 100 to 106 (6% increase)
- The inflation index rose from 75 to 125 (67% increase in prices)
- Population grew from 40 million to 42 million (5% increase)
The key insight: although money GDP increased by 6%, the price level increased by 67%, meaning real GDP actually fell. The purchasing power of the economy declined because prices rose much faster than nominal output.
This demonstrates why economists focus on real GDP rather than nominal GDP when assessing true economic performance. Nominal figures can be very misleading during periods of high inflation.
Tracking financial markets: the FTSE 100
The FTSE 100 index (Financial Times Stock Exchange 100, often called the 'Footsie') is a prominent example of index numbers used in financial markets. It tracks the performance of the 100 largest companies listed on the London Stock Exchange.
Key features of the FTSE 100:
- Launched in 1984 with a base value of 1,000 (not 100)
- Measures changes in the combined market value of major UK companies
- Serves as a barometer of UK economic performance and business confidence
- Never rebased (unlike many other indices)
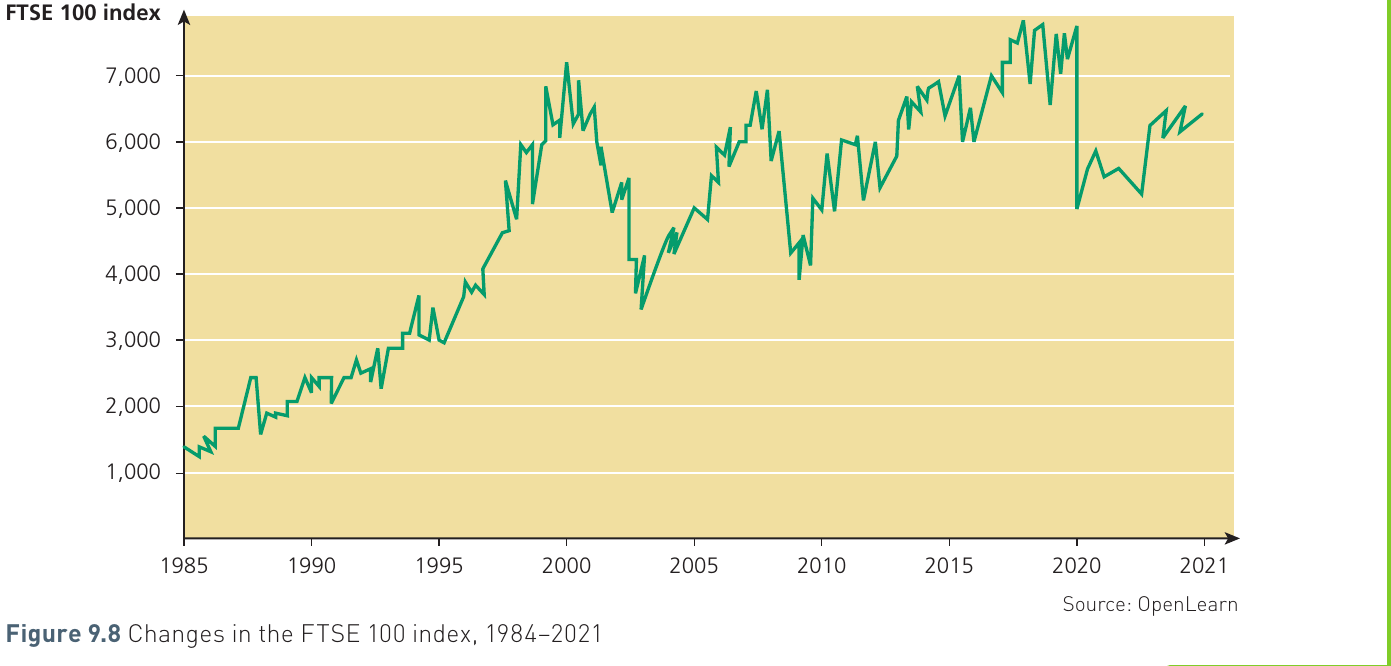
The FTSE 100 has experienced significant volatility over its history, reflecting major economic events such as the dot-com bubble (around 2000), the financial crisis (2008) and the Covid-19 pandemic (2020).
Important note: The composition of the FTSE 100 changes over time. Companies are promoted into or relegated from the index every three months based on their market capitalisation. Today's FTSE 100 is dominated by energy companies, retail companies and service industry companies, quite different from the manufacturing-dominated index of 1984.
Other economic indices
Beyond consumer price indices and stock market indices, other important index numbers include:
Producer Price Indices (PPI): These measure changes in input and output prices of goods bought and sold by UK manufacturers. Input prices track the cost of materials and fuels, while output prices (factory gate prices) show what manufacturers charge for their products.
Index of production: This measures the volume of production at base year prices for manufacturing, mining and quarrying, and energy supply industries.
Construction of price indices: the CPI
Understanding how the CPI is constructed helps explain both its uses and limitations. The process is more complex than simply averaging prices, and involves careful statistical methodology to ensure accuracy.
The shopping basket

The CPI is based on a representative 'shopping basket' of approximately 700 goods and services that reflect typical household spending patterns. The basket includes:
- Food and non-alcoholic drinks
- Housing, fuel and power
- Transport
- Recreation and culture
- Restaurants and hotels
- Clothing and footwear
- Household goods and services
- Communication
- Education
- Health
- Alcoholic drinks, tobacco and narcotics
What the basket represents:
The basket is meant to capture what households actually buy, not what they need or what is good for them. It simply reflects spending patterns.
Representative items:
It would be impractical to monitor every product in every shop. Instead, the CPI uses approximately 700 representative items. Prices of similar items can reasonably be assumed to move together in response to market forces.
Example of Representative Items:
For breakfast cereals, tracking the price of cornflakes, wheat biscuits and porridge oats gives a reasonable indication of breakfast cereal prices generally. If cornflakes increase by 5%, other similar cereals are likely to show similar price movements.
Weighting
Not all items in the basket have equal importance in the CPI calculation. Items are weighted according to their significance in household budgets. The weights reflect how much households spend on different categories.
For example, a 10% increase in petrol prices would have a much larger impact on the CPI than a 10% increase in tea prices, because households spend far more on petrol than on tea. The weighting system ensures the index accurately reflects the overall change in the cost of living.
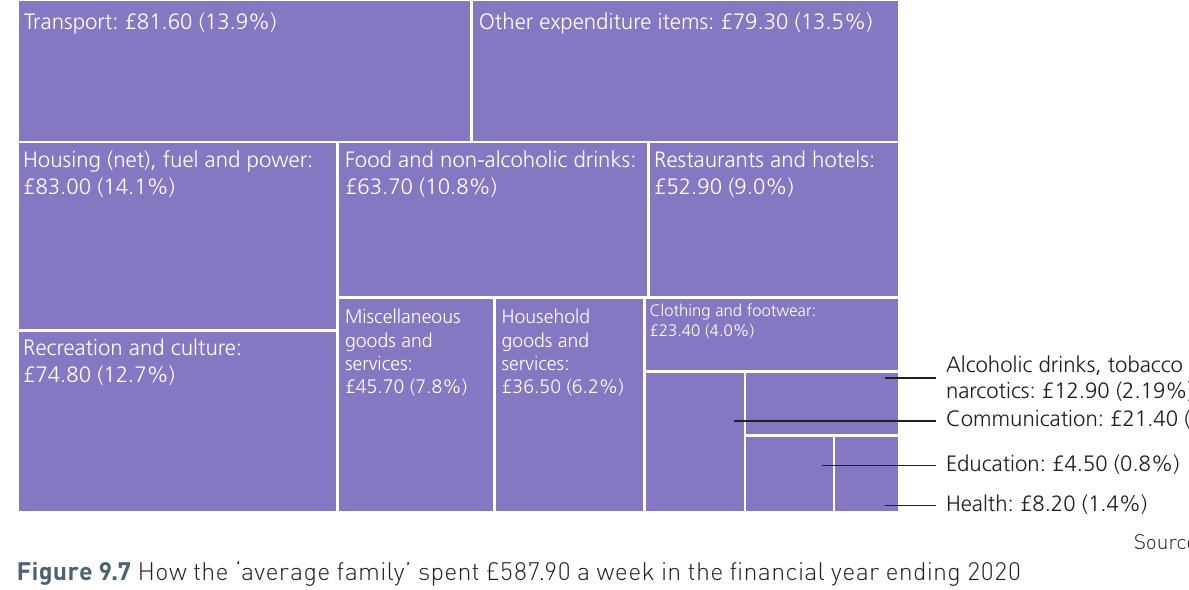
According to 2020 data, UK households spent an average of $587.90 per week, with the largest spending categories being:
- Housing, fuel and power: $83.00 (14.1%)
- Transport: $81.60 (13.9%)
- Recreation and culture: $74.80 (12.7%)
- Food and non-alcoholic drinks: $63.70 (10.8%)
These proportions determine the weights used in calculating the CPI.
Quality changes and basket updates
The shopping basket is not static. It is reviewed and updated annually to ensure it remains representative of current spending patterns.
Updates occur because:
- New products enter the market (e.g. smart phones, tablet PCs were added in recent years)
- Consumer preferences change over time
- Some products become obsolete
- Spending patterns shift (e.g. during Covid-19, spending on pets increased while spending on doughnuts fell)
Quality improvements also need to be considered. When a manufacturer changes the size or quality of a product, adjustments are made to ensure the index compares like-for-like.
Important for maintaining accuracy: The basket is fixed for 12 months at a time to ensure consistent year-on-year comparisons. However, by using a 'chain-linking' approach that connects the indices from different years, the index can accommodate changes in the basket without distorting comparisons.
Calculating the index
The process of calculating the CPI involves several stages:
- Collect price data: Approximately 180,000 price quotes are collected each month for the items in the basket
- Calculate individual price changes: Compare current prices to the previous January (or the previous year)
- Weight the price changes: Multiply each price change by its weight to reflect its importance
- Combine weighted changes: Sum all the weighted price changes
- Chain-link: Connect the current year's calculations with previous years' figures
This multi-stage process ensures the CPI accurately tracks price changes while accounting for changes in the basket composition over time.
Worked example: calculating a weighted price index
Let's work through a complete example to understand how weighted price indices are calculated.
Worked Example: Calculating a Weighted Price Index
Given data:
| Product | Year 1 price ($) | Year 2 price ($) | Weight |
|---|---|---|---|
| X | 6 | 9 | 1 |
| Y | 12 | 18 | 3 |
| Z | 20 | 15 | 2 |
Task: Calculate the weighted price index for Year 2 if Year 1 is the base year, and determine the inflation rate.
Solution:
Step 1: Calculate the price index for each product
Step 2: Multiply each index by its weight
Step 3: Sum the weighted indices
Step 4: Divide by the sum of weights
Step 5: Calculate the inflation rate
Since the base year index is 100 and Year 2 index is 125:
Interpretation: Overall, this basket of goods experienced a 25% price increase from Year 1 to Year 2, even though Product Z actually decreased in price. The weighted average reflects that Products X and Y (which increased by 50%) have a combined weight of 4, while Product Z (which fell by 25%) has a weight of only 2.
Interpreting index numbers: key considerations
Understanding what index numbers can and cannot tell us is crucial for avoiding common misinterpretations. Many errors in economic analysis stem from misreading or misapplying index number data.
The importance of the same base year
When comparing index numbers, it is essential that they share the same base year. Index numbers from different base years cannot be directly compared to determine absolute differences in levels.
Example: If Country A has an inflation index of 110 (base year 2015) and Country B has an inflation index of 105 (base year 2018), we cannot conclude that Country A has higher inflation. The different base years make such comparisons meaningless.
However, we can compare the rate of change within each country by examining how its index changes over time.
What index numbers show (and don't show)
Index numbers show:
- Percentage changes from the base year
- Rates of growth or decline
- Relative changes over time within the same data series
Index numbers do NOT show:
- Absolute values or levels
- Direct comparisons between different countries or regions (unless using the same base year)
- The actual magnitude of the variable being measured
Accuracy depends on data quality
The reliability of index numbers depends entirely on the accuracy of the underlying statistics. For macroeconomic indicators like GDP and inflation, the quality of data collection by the Office for National Statistics and other government sources is crucial.
Factors affecting accuracy include:
- Survey response rates
- Sampling methods
- Timing of data collection
- Adjustments for quality changes
- Methods of estimation for missing data
Key Points to Remember:
-
Index numbers provide a standardised way to track changes over time, with the base year set at 100. Values above 100 indicate increases, while values below 100 indicate decreases.
-
The CPI and RPI are the main price indices you need to know for A-Level Economics. The CPI measures consumer price inflation, while the CPIH includes housing costs. Both use a weighted basket of representative goods and services.
-
Weighting is crucial in price indices because different items have different importance in household budgets. A change in the price of petrol affects households more than an equivalent change in the price of tea.
-
Same base year is essential for valid comparisons. Index numbers with different base years cannot be directly compared to determine absolute differences in levels, only rates of change within each series.
-
Real GDP is calculated using index numbers to remove the distorting effects of inflation. This allows economists to measure actual changes in output rather than just changes in money values.