Resourcing (AQA A-Level Further Maths): Revision Notes
Resourcing
What is a resource?
In project management, a resource refers to the workforce required to complete a project. Different activities within a project may need different numbers of workers to be completed efficiently.
When managing resources, you need to:
- Determine how many workers are required at each stage when activities begin as early as possible
- Apply resource levelling to reschedule activities and reduce the total workforce needed
- Extend the project duration if there is a constraint on the maximum number of available workers
Resource histograms
A resource histogram is a bar chart that displays the number of workers needed at each point during a project. The histogram shows time along the horizontal axis and the number of workers on the vertical axis.
Drawing a resource histogram
To construct a resource histogram from a Gantt chart:
- Start with a Gantt chart showing all activities scheduled at their earliest start times
- For each time period, count how many activities are running simultaneously
- Add up the workers required for all concurrent activities
- Plot these totals as stacked bars on the histogram
The height of each bar indicates the total workforce requirement for that time period.
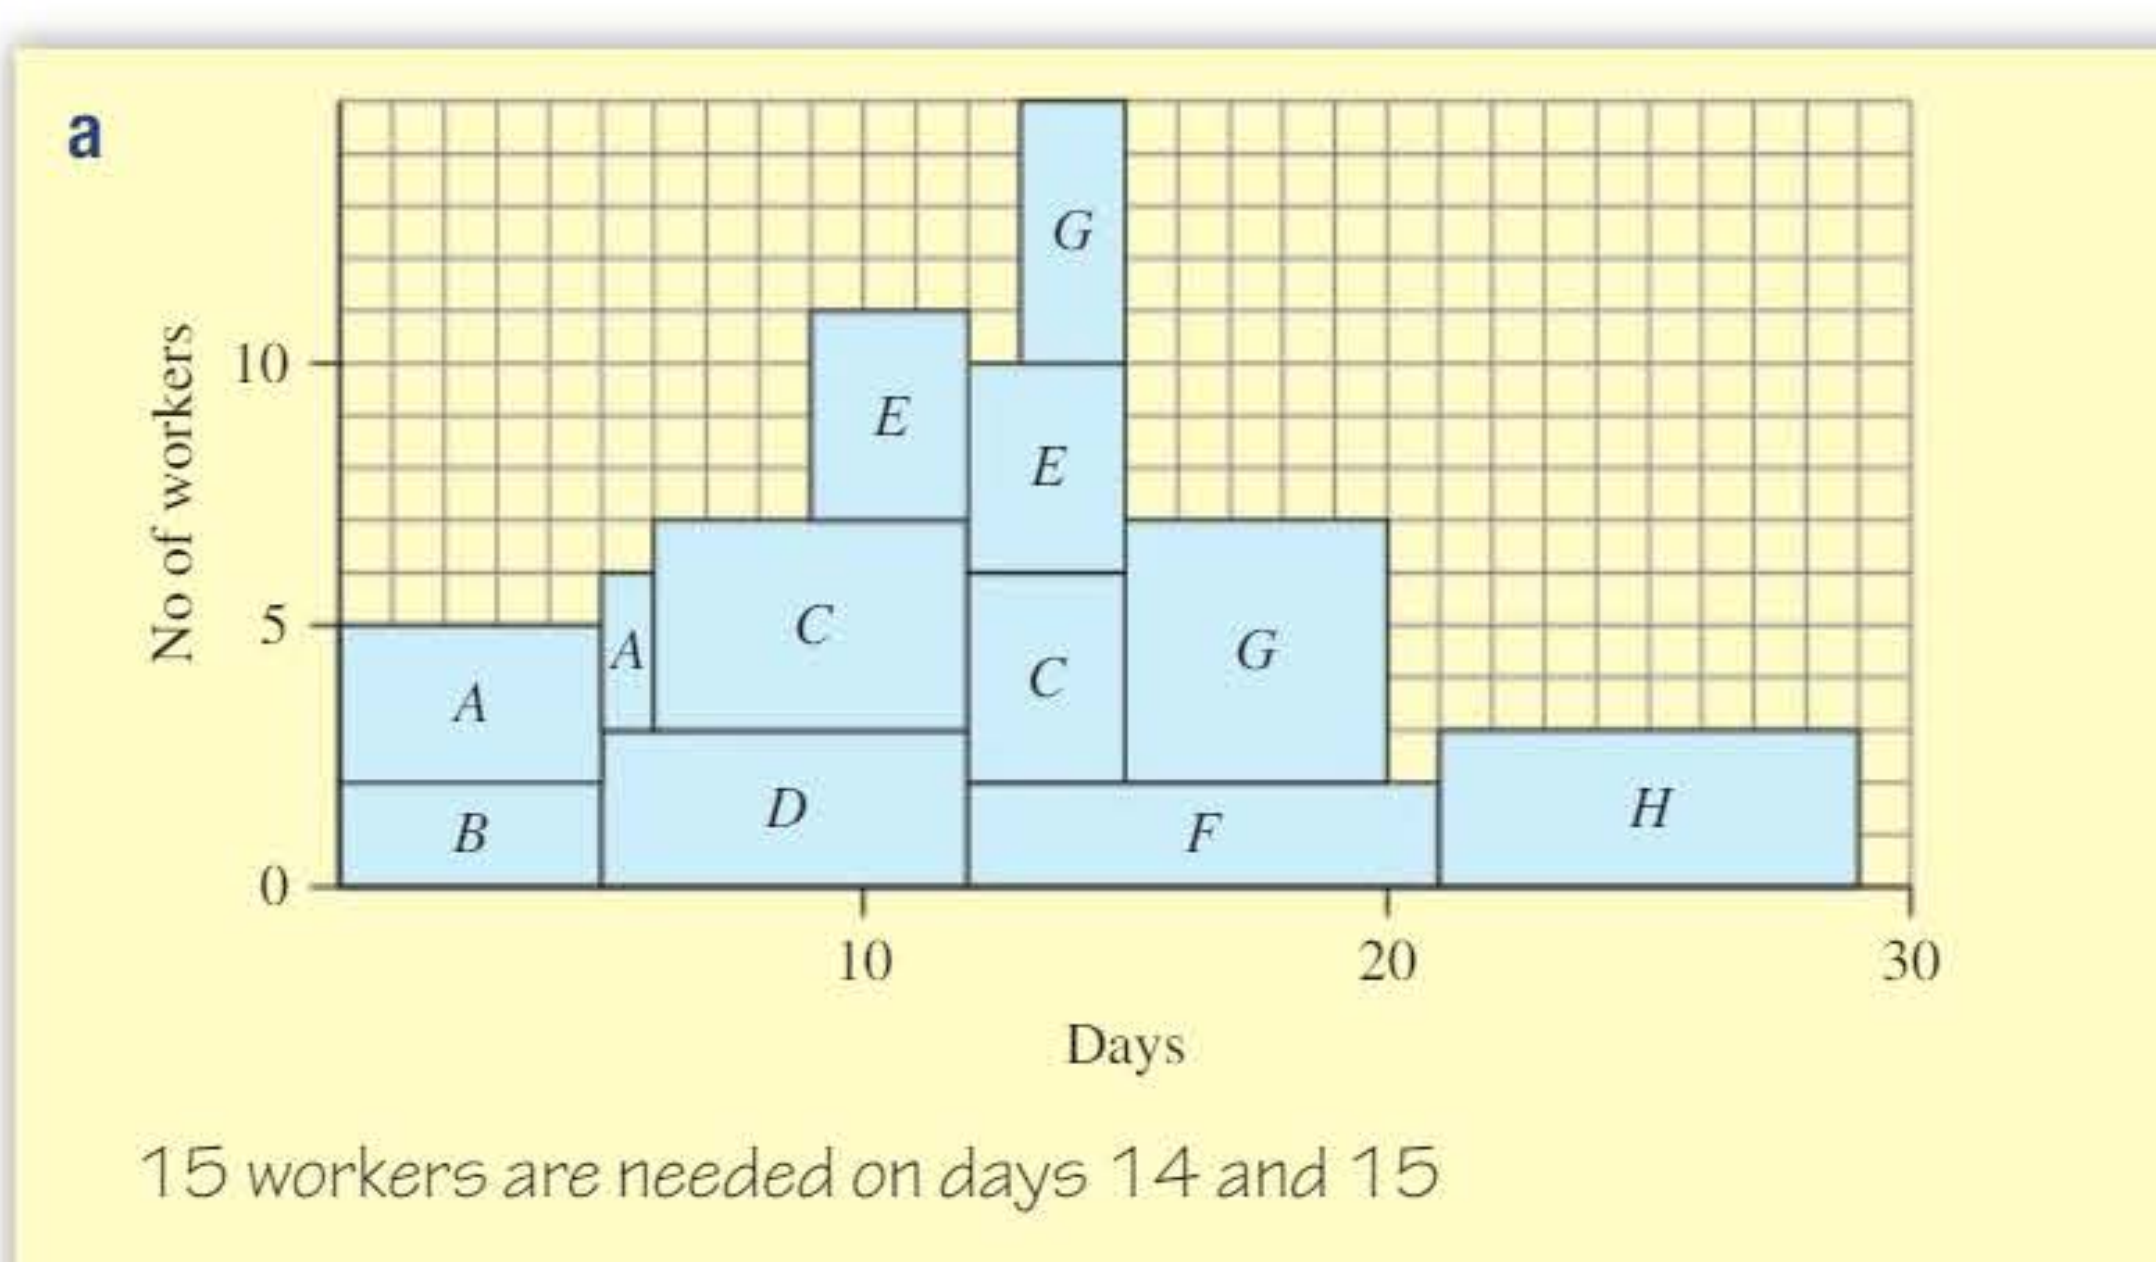
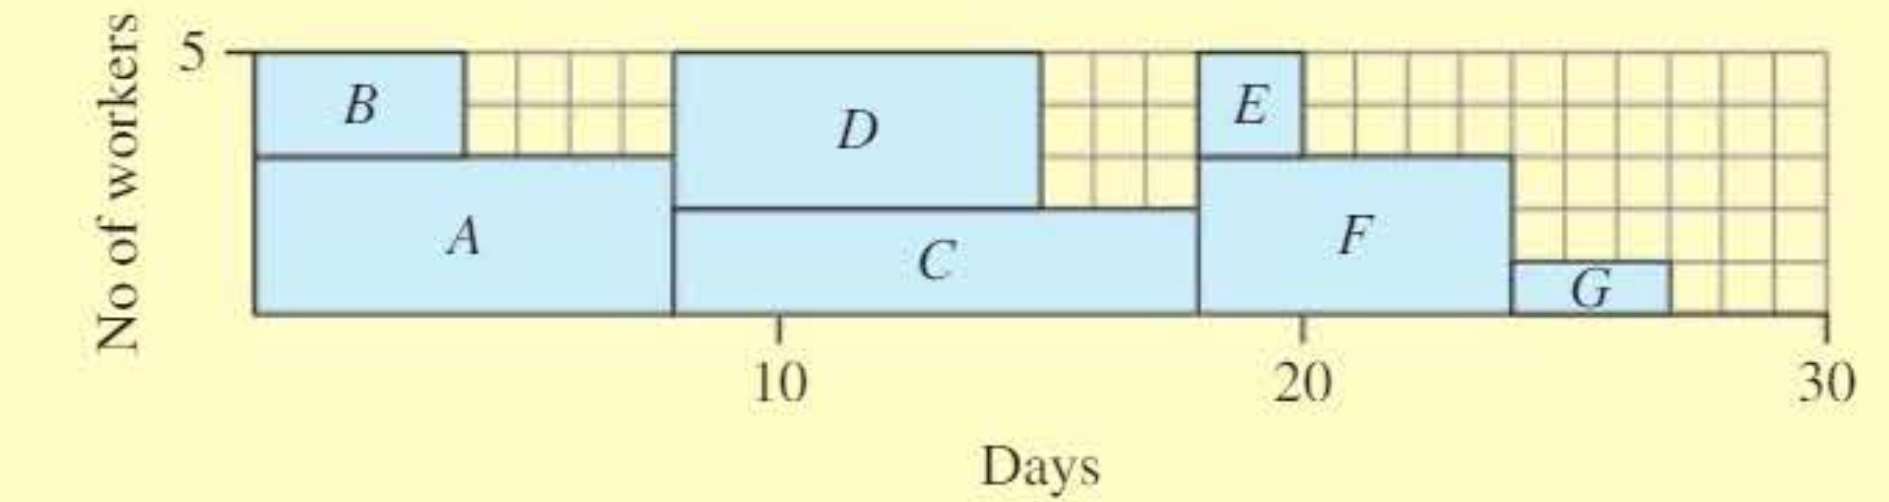
In the example above, the resource histogram shows that 15 workers are needed on days 14 and 15, which represents the peak workforce requirement.
Resource levelling
Resource levelling is a technique used to reduce the maximum number of workers needed by rescheduling activities within their available float time. Float is the flexibility in an activity's timing - it represents how much an activity can be delayed without affecting the project completion date.
How resource levelling works
Activities that are not on the critical path have float, which means they can be delayed without extending the overall project duration. By strategically delaying these activities, you can:
- Spread out the workforce requirements more evenly over time
- Reduce peak workforce demands
- Lower the maximum number of workers needed simultaneously
Activities on the critical path have zero float and cannot be delayed without extending the project.
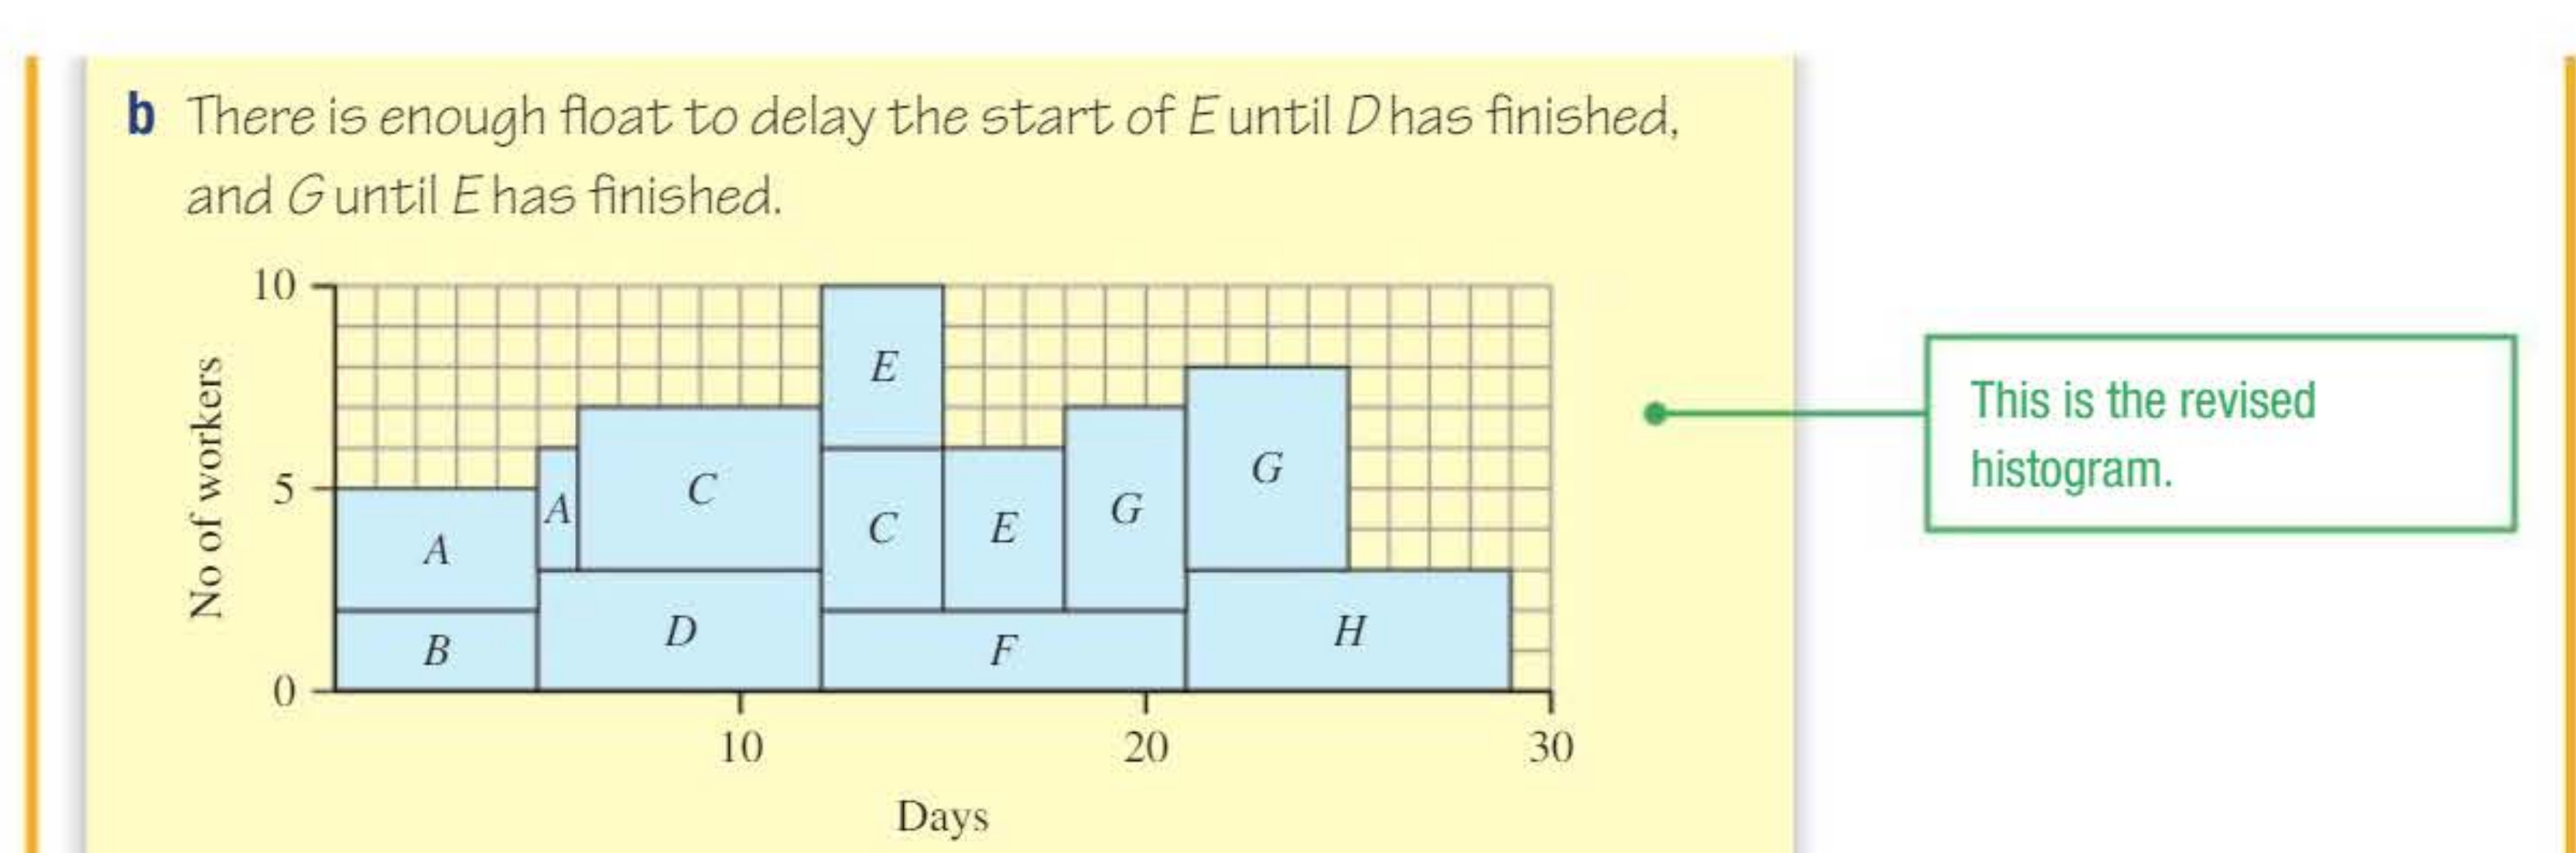
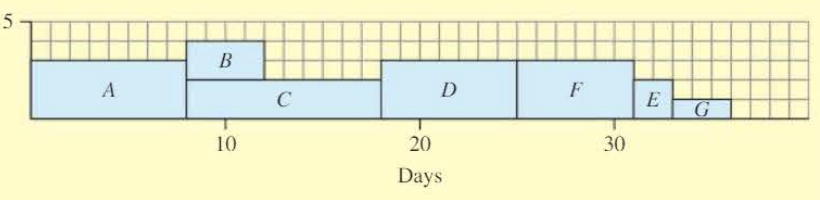
The diagram above shows a revised histogram after resource levelling. Notice how activity E has been delayed until D finishes, and G has been delayed until E finishes. This uses the available float to reduce the peak workforce requirement to 10 workers.
Strategy for solving resource levelling problems
Follow these steps systematically:
-
Find timing information: If necessary, calculate the earliest start time, latest finish time, and float for each activity
-
Sketch a Gantt chart: If one is not provided, draw a Gantt chart showing activities scheduled at their earliest start times
-
Draw the initial resource histogram: Assume all activities start as early as possible and show the total workers needed at each time
-
Reschedule activities: Use float to delay activities and reduce the workforce peak - focus on activities with the most float first
-
Check worker constraints: If there is a maximum number of workers available, you may need to extend the project duration by delaying critical activities
-
Answer the question: State clearly the minimum workers needed or the extended project duration
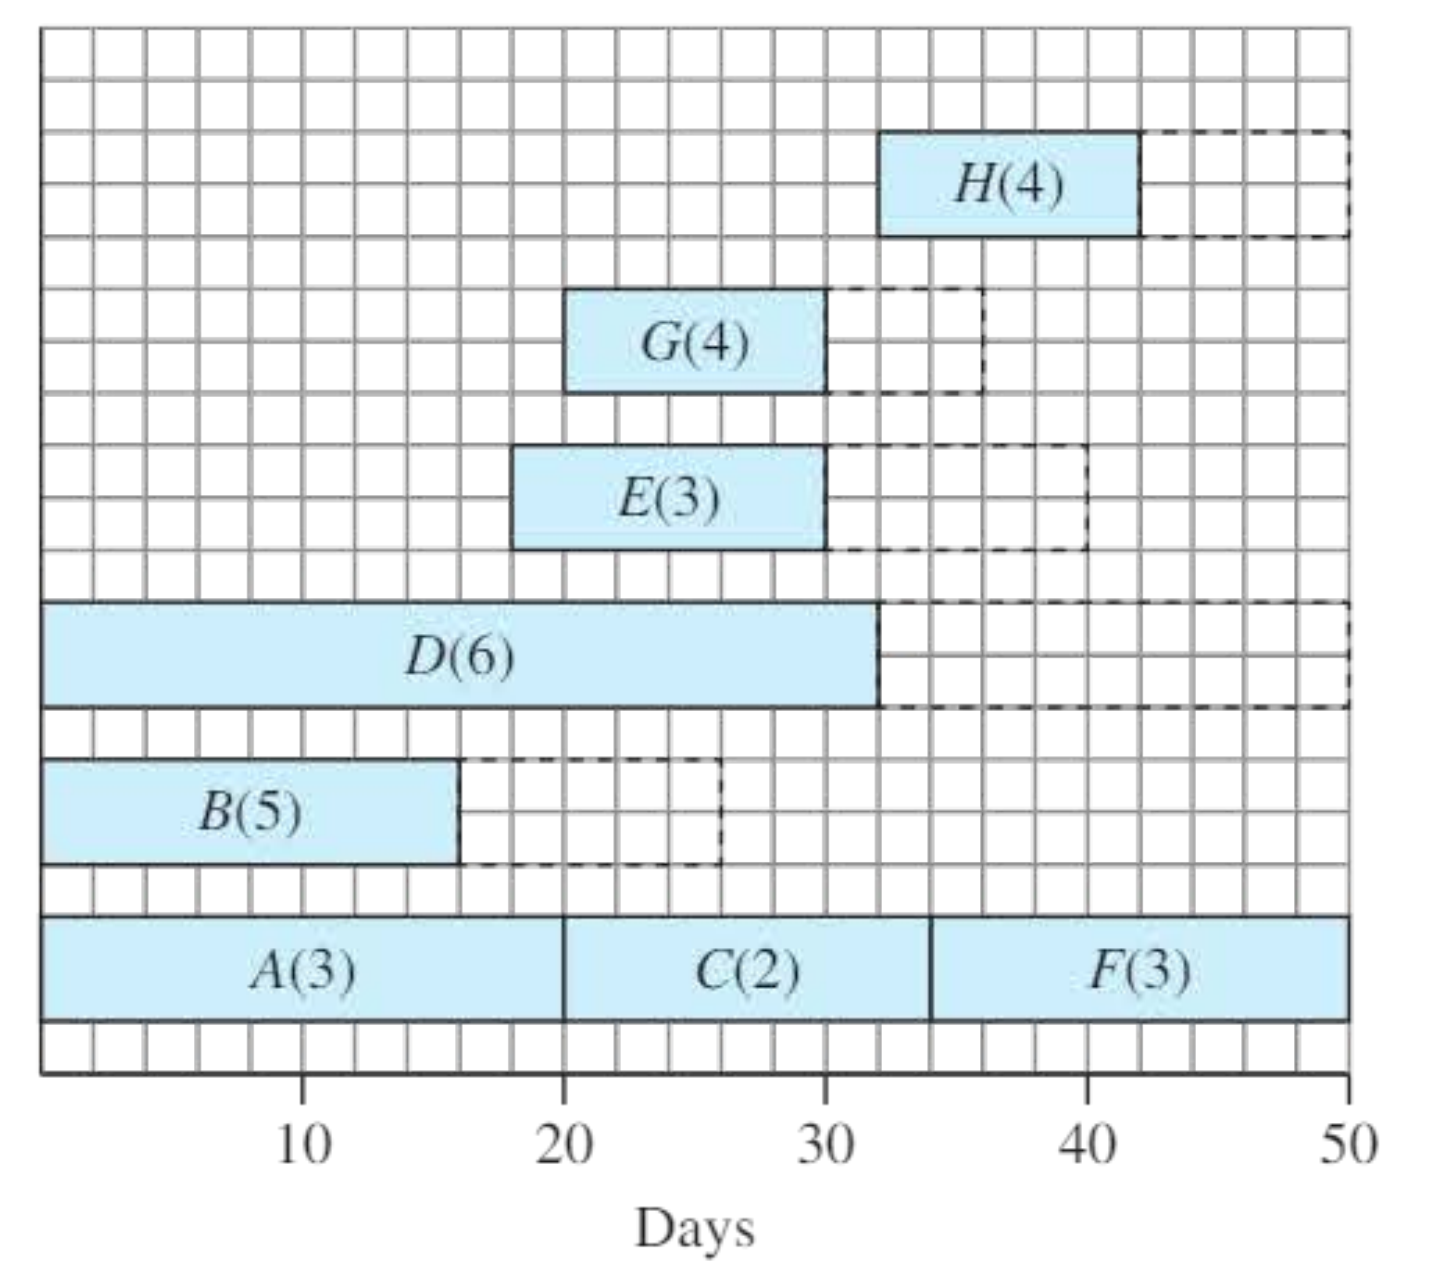
Worked example 1: Basic resource levelling
A Gantt chart shows activities in a project. The numbers in brackets indicate the workers needed for each activity.
Worked Example: Resource Levelling with Constraints
Part a: Draw a resource histogram assuming each activity starts as early as possible. How many workers are needed?
Solution a:
When all activities start at their earliest times, we stack the worker requirements:
The histogram shows 15 workers are needed on days 14 and 15. This is the maximum workforce requirement.
Part b: By rescheduling activities, find the least number of workers needed to complete the project in minimum time.
Solution b:
We look for activities with float that can be delayed:
- Activity E has float and can be delayed until D finishes
- Activity G has float and can be delayed until E finishes
After rescheduling, the project now requires only 10 workers. The project duration remains unchanged because we only delayed activities within their float.
Part c: If only 8 workers are available, find the length of time needed for the project.
Solution c:
The problem occurs on days 13-15. Since we need more workers than available, we must delay activity F (a critical activity) by 3 days. This extends the project from 29 days to 32 days.
Worked example 2: Resource constraints
A project is shown as a Gantt chart with activity durations and worker requirements in brackets.
Worked Example: Limited Workforce Availability
Part a: Draw a resource histogram assuming each activity starts as soon as possible. How many workers are needed?
Solution a:
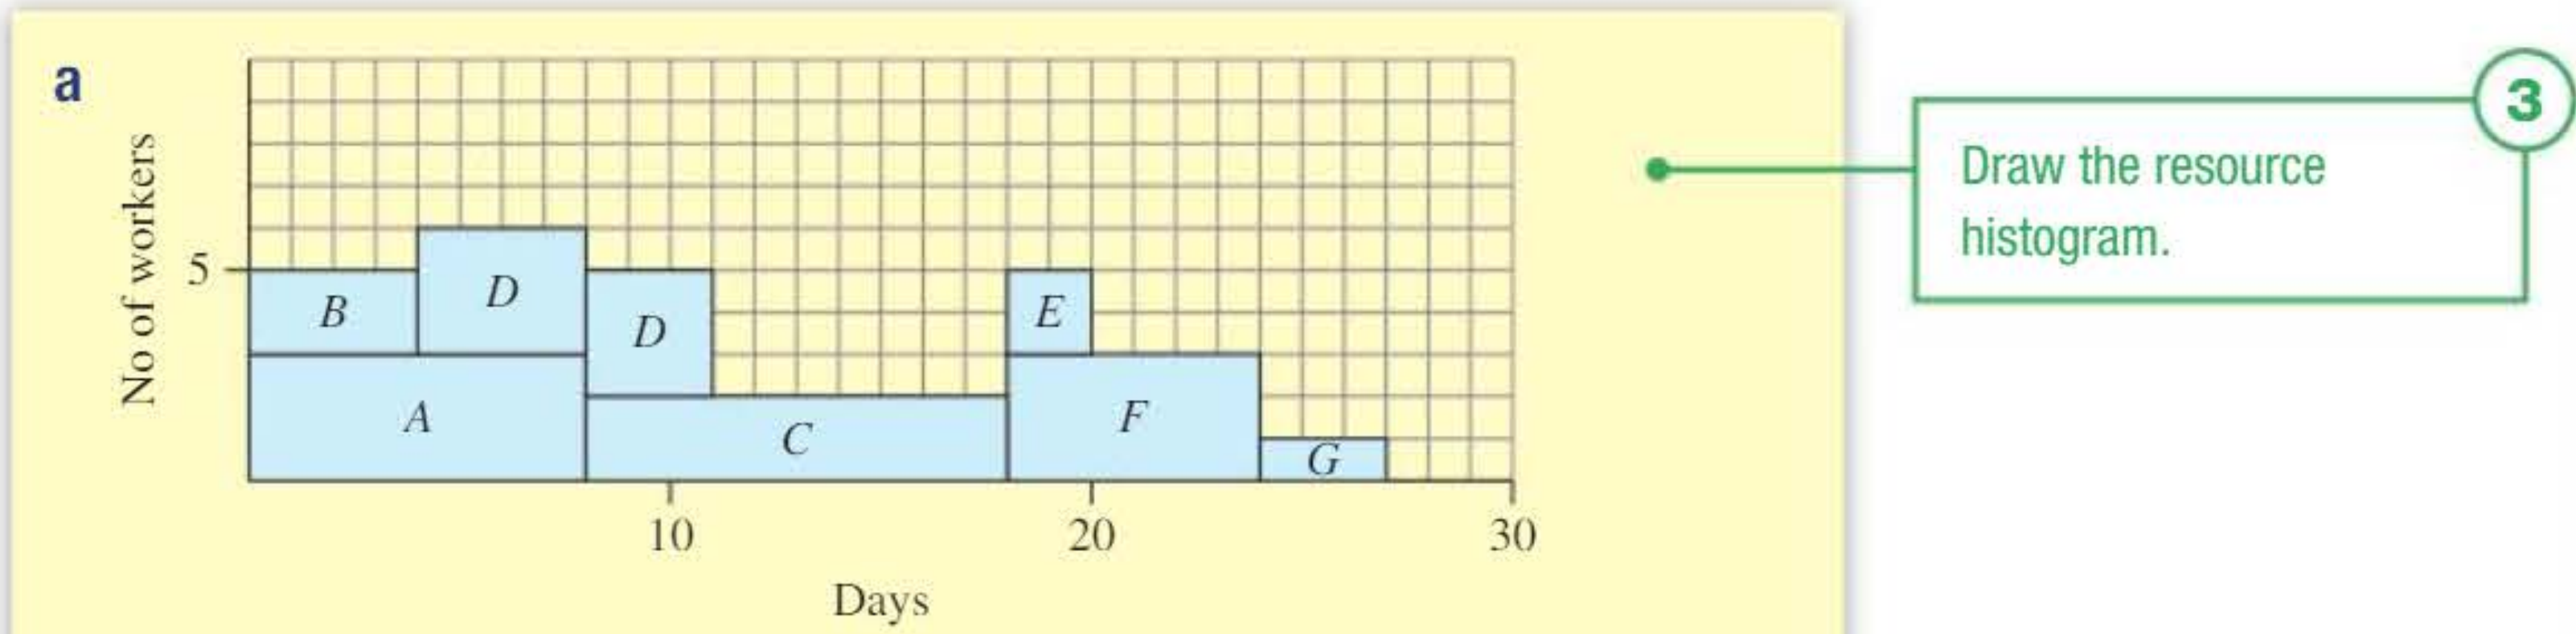
Counting the overlapping activities at each time period and summing their worker requirements, the initial histogram shows that 6 workers are needed at the peak.
Part b: Show that the project can be completed on time if only 5 workers are available.
Solution b:
By delaying the start of activity D (which has float), we can reduce the peak:
The project can now be completed with only 5 workers, and the duration remains unchanged at 27 days because we only rescheduled within available float.
Part c: Find the effect on project duration if only 4 workers are available.
Solution c:
With only 4 workers available, the only activities that can run in parallel are B and C (since they together require exactly 4 workers).
The resource histogram shows the project now takes 36 days to complete. The limited workforce forces us to run most activities sequentially rather than in parallel, extending the project by 9 days.
Exam tips for resourcing problems
Drawing histograms:
- Always label both axes clearly (time and number of workers)
- Stack activities vertically - don't overlap them horizontally
- Check that the width of each bar matches the activity duration
- Use the activity labels to identify which activities contribute to each bar
Resource levelling tips:
- Always start by identifying which activities have float
- Activities on the critical path cannot be delayed without extending the project
- Delay activities with the most float first
- Work systematically through the timeline from left to right
Worker constraints:
When dealing with workforce limitations, remember to:
- Check if the required workers exceed the available workers - this means you must extend the project
- Focus on the time periods where the constraint is violated
- Consider which critical activities must be delayed
- Each day a critical activity is delayed extends the project by that amount
Common mistakes to avoid:
- Don't forget to update the histogram after rescheduling activities
- Remember that delaying a critical activity always extends the project duration
- When counting workers, include all activities running simultaneously at each time
- Don't confuse the number of workers with the duration of activities
Remember!
Key Points to Remember:
- A resource histogram visualises workforce requirements over time by stacking activities according to their worker needs
- Resource levelling uses float to reschedule non-critical activities, reducing the peak number of workers required without extending project duration
- Activities with zero float (critical activities) cannot be delayed without extending the overall project completion time
- When worker availability is limited below the required peak, the project must be extended by delaying critical activities
- Always follow a systematic approach: draw the Gantt chart, create the initial histogram, identify float, reschedule activities, and check constraints