Graphs and Networks 1 (AQA A-Level Further Maths): Revision Notes
Graphs and Networks
What is a graph?
A graph is a mathematical diagram made up of points connected by lines. Each point is called a vertex (plural: vertices), and each line joining two points is called an edge.
Key definition:
A graph consists of a set of vertices connected by edges. It is possible for a vertex to exist without any edges connected to it.
The visual layout or shape of a graph does not matter. What matters is which vertices are connected to which other vertices. Three graphs that show the same set of connections are considered to be the same graph, even if they look different.
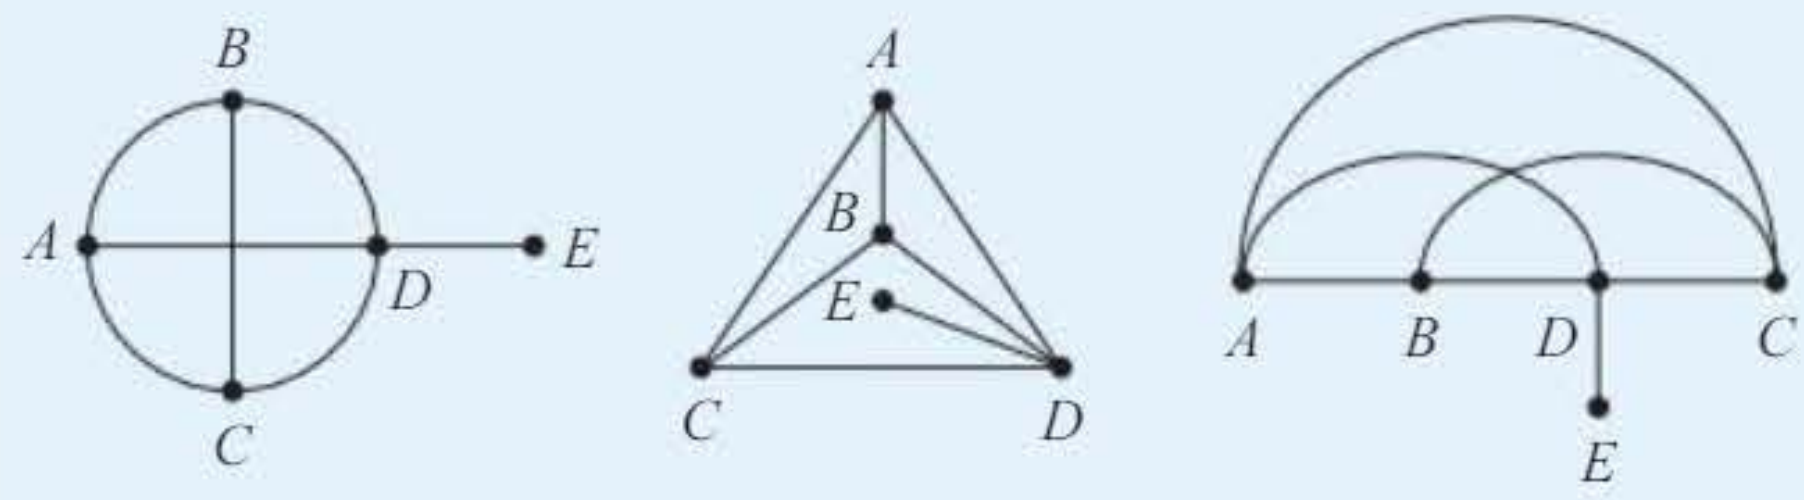
Graphs with identical connection patterns but different visual appearances are called isomorphic (meaning "of the same form"). The three diagrams above are isomorphic because they show the same relationships between vertices.
Connected graphs
A graph is connected if you can travel from any vertex to any other vertex by following edges. You may pass through other vertices along the way.
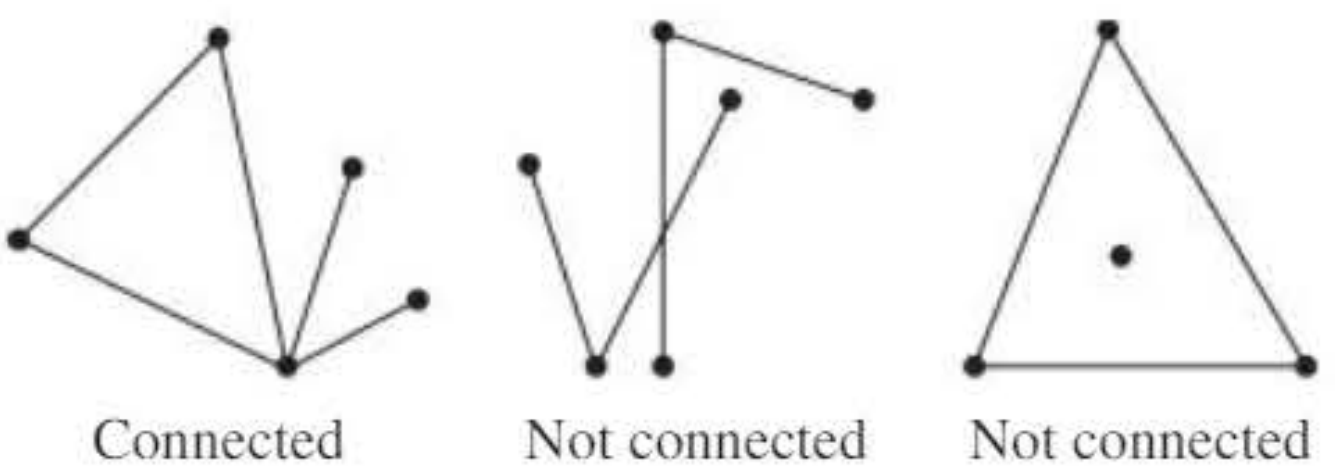
In the examples above:
- The left graph is connected because you can reach any vertex from any other vertex
- The middle and right graphs are not connected because some vertices cannot be reached from others
Special types of edges
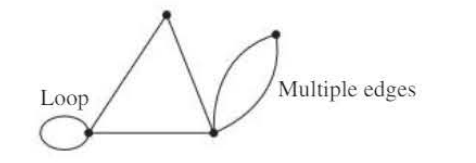
Multiple edges and loops
Two or more edges may connect the same pair of vertices. These are called multiple edges.
An edge can also connect a vertex to itself. This is called a loop.
Simple graphs
A simple graph is a graph that has no loops and no multiple edges. Simple graphs are the most commonly studied type.
Remember: A simple graph has NO loops and NO multiple edges. This is the standard type of graph you'll work with most often. If a graph has loops or multiple edges, it must be explicitly stated.
Subgraphs and sub-divisions
Subgraphs
A subgraph is formed by using only some of the vertices and edges from an original graph. You select a subset of the vertices and include only the edges that connect those selected vertices.
Sub-divisions
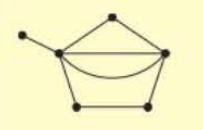
A sub-division of a graph is created by adding extra vertices along the existing edges. This does not change the fundamental structure of the graph.
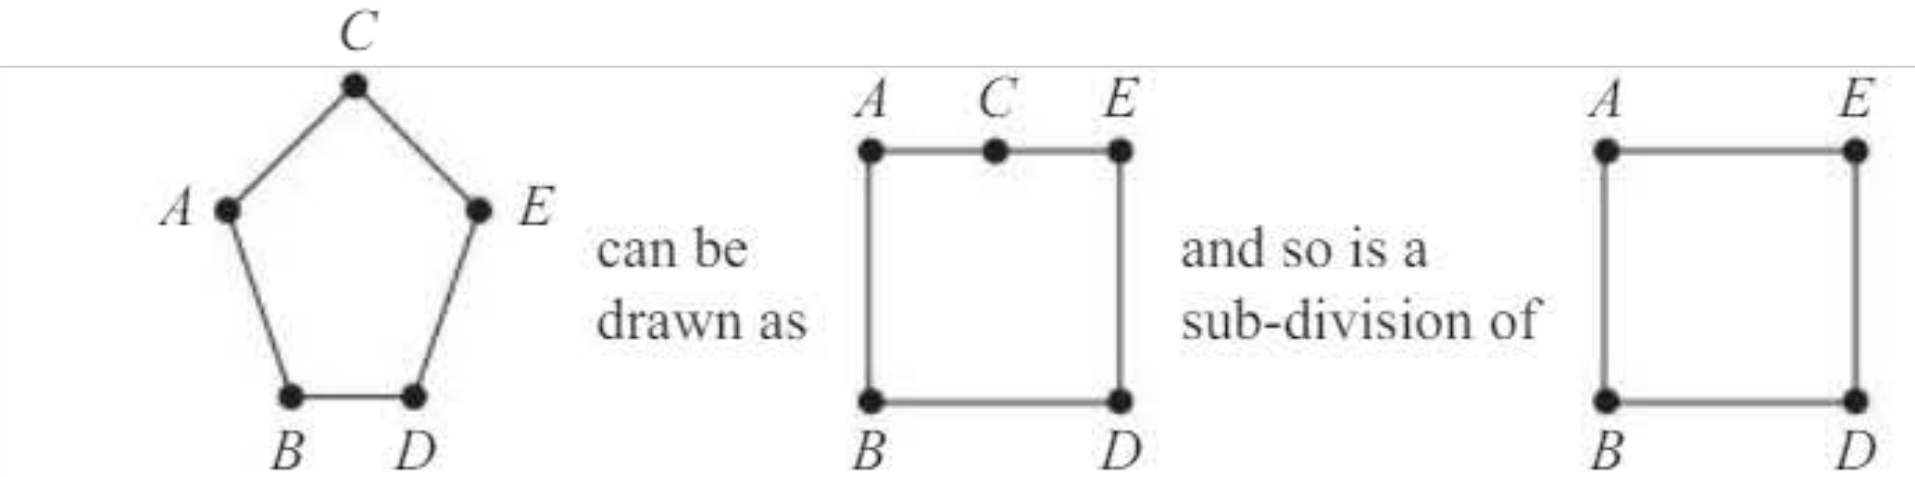
The diagram shows how a pentagon can be redrawn as a square by recognizing that two vertices lie on the same edge. This square is a sub-division of the basic four-vertex square on the right.
Complete graphs
If a simple graph has an edge connecting every possible pair of vertices, it is called a complete graph.
Key notation:
The complete graph with vertices is called .
This notation is standard in graph theory - the "K" stands for complete, and the subscript tells you how many vertices it has.
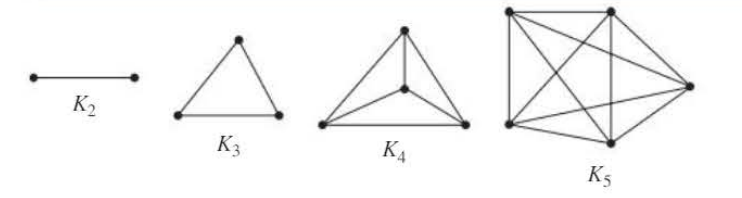
Examples of complete graphs:
- : Two vertices connected by one edge
- : Three vertices forming a triangle
- : Four vertices with all six possible connections
- : Five vertices with all ten possible connections
Complete graphs can be drawn in many different ways, but all representations of are isomorphic to each other.
Bipartite graphs
In some graphs, the vertices belong to two distinct sets. Each edge joins a vertex in one set to a vertex in the other set. No edges connect vertices within the same set.
This type of graph is called a bipartite graph.
For example, if the two sets of vertices are and , then edges can only connect vertices from the first set to vertices in the second set.
Complete bipartite graphs
If every possible edge connecting the two sets is present, the graph is a complete bipartite graph.
Key notation:
The complete bipartite graph connecting vertices to vertices is called .
The two numbers in the subscript tell you the size of each vertex set. For example, has 3 vertices in one set and 2 in the other.
Degree (order) of a vertex
The degree or order of a vertex is the number of edges meeting at that vertex.
When counting the degree:
- Each normal edge contributes 1 to the degree
- A loop contributes 2 to the degree (because it connects the vertex to itself at both ends)
The handshaking lemma
An important relationship exists between the number of edges and the sum of the degrees in any graph.
The Handshaking Lemma
This is called the handshaking lemma because each edge connects two vertices (like two hands in a handshake), so each edge contributes 1 to the degree of each of its two endpoints.
Why this works: Every edge has two ends, and each end contributes to the degree of one vertex. So when you count up all the degrees, you're counting each edge twice - once at each end.
A lemma is a proven mathematical fact that can be used in subsequent work without proof.
Worked Example: Verifying the handshaking lemma
Problem: Draw a graph with vertices labelled 2, 3, 4, ..., 9. Connect two vertices with an edge only if they have no common factor (are coprime). Count the edges and verify the relationship between edges and degrees.
Solution:
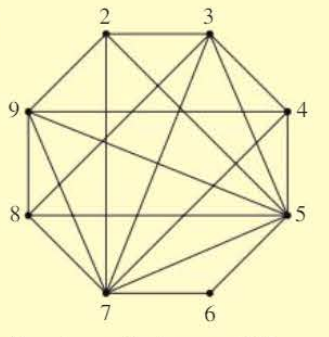
After drawing the graph:
- Number of edges = 19
- Individual degrees are: 4, 5, 4, 7, 2, 7, 4, and 5
- Total of degrees =
- Verification: ✓
The relationship holds because each edge contributes 1 to the degree at each of its two endpoints.
Planar graphs
A graph is planar if it can be drawn in a plane such that no two edges cross each other except at vertices.
When you draw a graph without crossing edges, you are drawing it "in the plane."
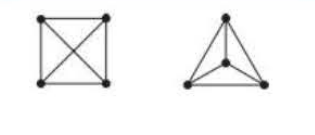
The complete graph can be drawn in two ways. The version on the right is preferable because none of the edges cross. This demonstrates that is planar.
Faces in planar graphs
When a connected graph is drawn in the plane without crossing edges, the edges divide the plane into regions called faces. The area outside the graph is also counted as a face, called the infinite face.
Euler's formula for planar graphs
For any connected planar graph with vertices, edges, and faces, these quantities are related by Euler's formula:
Worked Example: Verifying Euler's formula
Problem: Show that Euler's formula holds for the given graph.
Solution:
Count the components:
- (the graph has 6 vertices)
- (the graph has 8 edges)
- (there are 4 faces, including the infinite face)
Verify the formula:
Therefore, Euler's formula holds true for this graph.
Worked Example: Proving Euler's formula
Problem: Prove that Euler's formula holds for any connected planar graph.
Proof outline:
Consider any connected planar graph. Remove edges one by one without disconnecting the graph.
When you remove an edge:
- If it's a simple edge connecting two different regions, then and . The value remains unchanged
- If removing the edge would disconnect part of the graph (or if it's part of a loop), then and . Again, is unchanged
Continue removing edges until you reach a single vertex with no edges. At this point:
- (only the infinite face remains)
This gives .
Since the value of did not change as we reduced the graph, the original graph must also satisfy .
Representing graphs with matrices
Besides drawing diagrams, there are two main ways to record a graph mathematically:
- Vertex set and edge set: List all vertices and all edges
- Adjacency matrix: Create a table showing connections between vertices
Adjacency matrices
An adjacency matrix is a square table that shows how many direct connections exist between each pair of vertices.
The entry in row and column represents the number of edges connecting vertex to vertex .
Worked Example: Adjacency matrix for a standard graph
Problem: a) List the vertex set and edge set for the given graph. b) Draw an adjacency matrix for the graph.
Solution:
a) Vertex set: Edge set:
b) The adjacency matrix counts the number of direct routes between each pair of vertices:
| A | B | C | D | |
|---|---|---|---|---|
| A | 0 | 1 | 1 | 1 |
| B | 1 | 2 | 1 | 0 |
| C | 1 | 1 | 0 | 2 |
| D | 1 | 0 | 2 | 0 |
Note: The entry for B to itself is 2 because the loop at B can be traversed in either direction.
Adjacency matrices for bipartite graphs
For a bipartite graph, the adjacency matrix contains two square blocks of zeros (representing no connections within each set). This can be simplified to a reduced form that only shows connections between the two sets.
The reduced form is a smaller rectangular matrix showing only the connections between the two vertex sets. This saves space and makes the structure clearer.
Directed graphs
Sometimes edges in a graph represent one-way connections (like one-way streets). These edges are called directed edges, and the graph is called a directed graph or digraph.
For directed graphs, the adjacency matrix is no longer symmetrical. You need to specify 'from' and 'to' directions:
- Rows represent the starting vertex ('from')
- Columns represent the ending vertex ('to')
The entry in row and column shows the number of directed edges from vertex to vertex .
Complement of a graph
For every simple graph , there is a corresponding graph called the complement of .
The complement is formed by:
- Including all edges that do not exist in
- Excluding all edges that do exist in
- Keeping the same set of vertices
When you combine and , you get a complete graph.
Finding the complement using an adjacency matrix
You can find the adjacency matrix for by changing zeros to ones and ones to zeros in the adjacency matrix of .
Important: Do not change the leading diagonal (the entries where row equals column), because loops are not added when forming the complement.
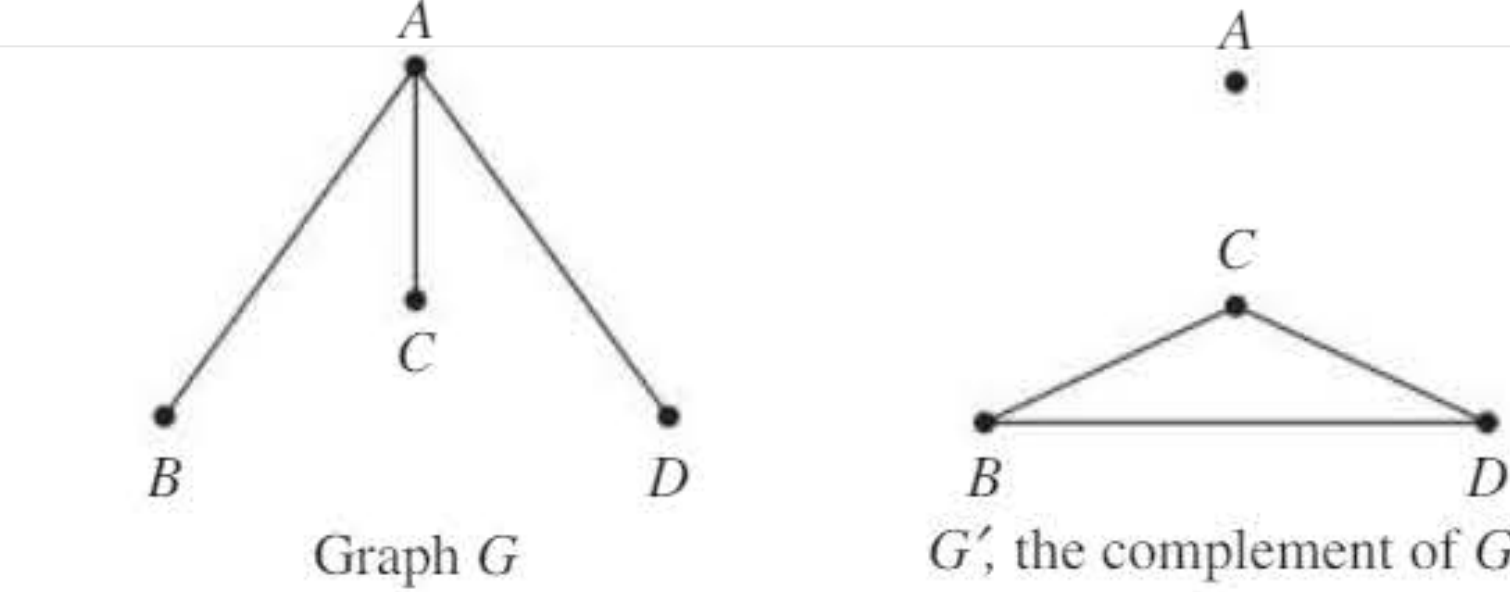
Worked Example: Finding the complement
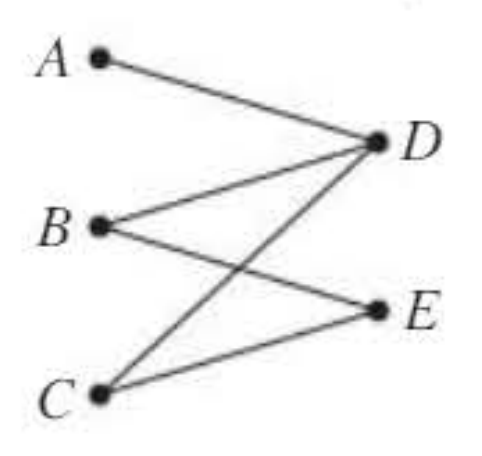
Problem: Draw the adjacency matrix for graph , then find the adjacency matrix for its complement , and draw .
Solution:
The adjacency matrix for is:
| A | B | C | D | E | |
|---|---|---|---|---|---|
| A | 0 | 1 | 0 | 0 | 0 |
| B | 1 | 0 | 1 | 0 | 1 |
| C | 0 | 1 | 0 | 0 | 1 |
| D | 0 | 0 | 0 | 0 | 1 |
| E | 0 | 1 | 1 | 1 | 0 |
Change 1 to 0 and 0 to 1 (except on the leading diagonal):
| A | B | C | D | E | |
|---|---|---|---|---|---|
| A | 0 | 0 | 1 | 1 | 1 |
| B | 0 | 0 | 0 | 1 | 0 |
| C | 1 | 0 | 0 | 1 | 0 |
| D | 1 | 1 | 1 | 0 | 0 |
| E | 1 | 0 | 0 | 0 | 0 |
The complement graph can now be drawn from this matrix.
Networks (weighted graphs)
A network, or weighted graph, is a graph where each edge (or arc) has a number associated with it. This number is called the weight of the arc.
Weights can represent:
- Distances between locations
- Travel times
- Costs
- Capacities
- Or any other numerical quantity
When discussing networks, the terms 'node' and 'arc' are often used instead of 'vertex' and 'edge'. These are simply alternative names for the same concepts.
Distance matrices
A network can be represented using a distance matrix, where entries show the weights of the arcs connecting vertices.
If no direct connection exists between two vertices, the entry is left blank or marked with a dash.
Worked Example: Creating a distance matrix
Problem: This network shows travel times (in minutes) between five Somerset towns. Draw a distance matrix to represent this network.
Solution:
Abbreviate the towns as B (Bridgwater), C (Cheddar), G (Glastonbury), S (Shepton Mallet), and W (Wells).
| B | C | G | S | W | |
|---|---|---|---|---|---|
| B | - | 28 | 25 | - | 32 |
| C | 28 | - | 18 | - | 15 |
| G | 25 | 18 | - | 12 | 10 |
| S | - | - | 12 | - | 8 |
| W | 32 | 15 | 10 | 8 | - |
The matrix is symmetrical because travel times are the same in both directions.
The triangle inequality
If the weights in a network represent direct, straight-line distances, then they must obey the triangle inequality.
The Triangle Inequality
The sum of the lengths of any two sides of a triangle cannot be less than the length of the third side.
Mathematically:
This means that going directly from A to C cannot be longer than going from A to B and then from B to C.
Important note: If distances represent 'wiggly' routes, or if weights represent other quantities like travel times or costs, the network may not satisfy the triangle inequality.
Worked Example: Triangle inequality in networks
Problem: This network shows travel times (in minutes) between four towns. a) Show that this network does not satisfy the triangle inequality. b) Construct a table of shortest travel times. c) Draw a graph for the network corresponding to the shortest times.
Solution:
a) Check one triangle: but So , which violates the triangle inequality.
b) Calculate shortest routes by comparing direct and indirect paths:
| A | B | C | D | |
|---|---|---|---|---|
| A | - | 9 | 14 | 7 |
| B | 9 | - | 5 | 13 |
| C | 14 | 5 | - | 8 |
| D | 7 | 13 | 8 | - |
c) The graph shows all direct connections with shortest times as weights:
The resulting network satisfies the triangle inequality because it represents optimal routes.
Key Points to Remember
-
A graph consists of vertices (points) connected by edges (lines). The visual layout doesn't matter—only which vertices connect to which.
-
The handshaking lemma states that the sum of all vertex degrees equals twice the number of edges: . This is because each edge contributes to two vertices.
-
For connected planar graphs, Euler's formula relates vertices, faces, and edges: . Remember to count the infinite face!
-
Adjacency matrices provide a systematic way to represent graphs. For directed graphs, use 'from' (rows) and 'to' (columns). For bipartite graphs, use the reduced form for efficiency.
-
In networks representing physical distances, the triangle inequality must hold: . However, this may not apply to travel times or costs where indirect routes can be more efficient.