Portfolio Analysis (Edexcel A-Level Business): Revision Notes
Portfolio Analysis
What is portfolio analysis?
Portfolio analysis is a strategic management tool that helps businesses categorise and evaluate all their products and services. The main purpose is to understand where each product fits within the company's overall strategic plans and to make informed decisions about resource allocation, investment priorities, and product development.
By systematically reviewing the entire product portfolio, businesses can identify which products deserve more investment, which should be maintained, and which might need to be discontinued. This process enables more effective strategic planning and ensures resources are directed towards products with the greatest potential.
The two-step process
Portfolio analysis follows a structured approach consisting of two key steps:
Step 1: Create a comprehensive overview
The first step requires businesses to conduct a full and detailed audit of all products and services currently in their portfolio. This means listing every product line, service offering, and business unit to get a complete picture of what the company offers to the market.
Step 2: Evaluate performance
Once all products are identified, the next step involves analysing the performance of each by examining:
- Current and projected sales – how the product is selling now and forecasts for future sales
- Current and projected costs – the expenses associated with producing and marketing the product
- Competitor activity – what rivals are doing and potential future competitive threats
- Risk factors – any issues that could negatively affect the product's performance
This two-step approach provides a foundation for making strategic decisions about product development, marketing investment, and resource allocation.
The Boston Matrix (BCG Matrix)
The Boston Consulting Group developed the Boston Matrix (also known as the BCG Matrix or Growth Share Matrix) as an advanced tool for portfolio analysis. This framework categorises products based on two key dimensions: market growth rate and market share.
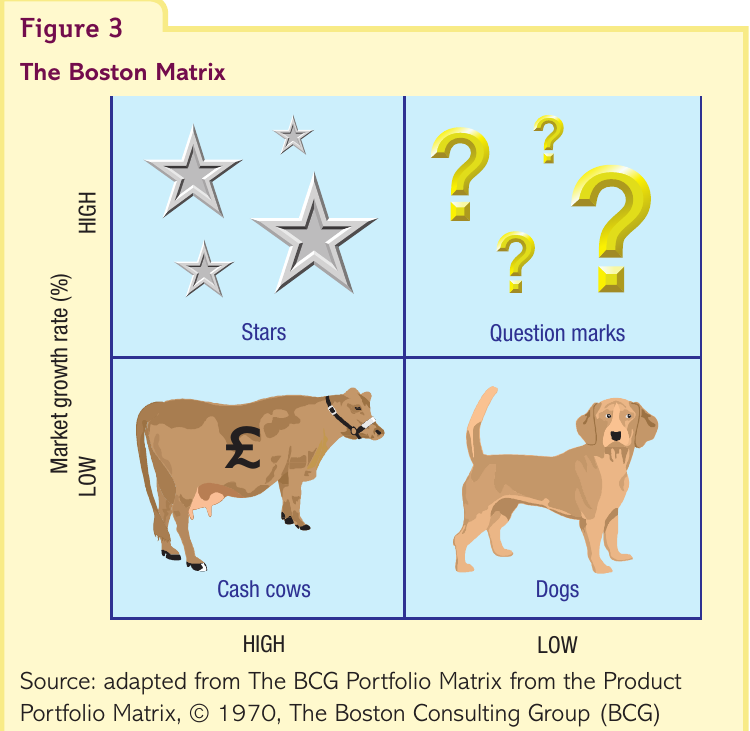
The matrix plots products into four distinct categories, each requiring different strategic approaches:
Stars
Stars are products positioned in high-growth markets where the business holds a high market share. These products are performing strongly compared to competitors and represent the future of the business. Stars typically require significant investment to maintain their competitive position and support continued growth. The strategic goal is to nurture these products so they eventually become cash cows as the market matures.
Strategic approach: Invest heavily to maintain market leadership and maximise growth potential. For example, a business might adopt a market penetration strategy to increase sales revenue and expand market share while the product remains competitive.
Cash cows
Cash cows operate in low-growth markets but command high market shares. These are mature, established products that generate more cash than they consume. Because the market is no longer growing rapidly, these products don't require substantial investment but continue to deliver strong profits. The cash generated by these products can fund investment in other areas of the business, particularly stars and promising question marks.
Strategic approach: Maintain market position with minimal investment and use generated cash to support other products in the portfolio.
Question marks
Question marks (also called problem children) are products with low market shares operating in high-growth markets. These products consume significant amounts of cash but provide little return at present. However, they represent opportunities because they operate in expanding markets. The key strategic challenge is determining whether to invest heavily to increase market share (turning them into stars) or to divest.
Strategic approach: Requires careful analysis and decision-making. Businesses must evaluate whether there is realistic potential for the product to gain market share. If so, investment may be justified. If not, resources might be better allocated elsewhere. A business might choose to move a product out of a low-growth market segment and target a market with higher growth prospects.
Dogs
Dogs are products with low market share in low-growth markets. These products may break even but offer little prospect of future growth. They consume management time and resources that could be better deployed on more promising products. Dogs typically tie up capital without generating meaningful returns.
Strategic approach: Consider selling or divesting these products. The matrix can help identify dogs that need to be discontinued to cut costs and support other strategic priorities, such as pursuing cost leadership.
Using the Boston Matrix for strategic decisions
The Boston Matrix serves as a decision-making tool to help businesses identify appropriate strategies for different products. By understanding where products sit within the matrix, managers can make informed choices about resource allocation and strategic direction.
For example:
- A product identified as a star might lead the business to adopt aggressive market penetration strategies to maximise market share while competitive advantage exists
- A product classified as a question mark might prompt the business to decide between heavy investment to build market share or divestment to reduce cash drain
- Products identified as dogs could be targeted for discontinuation as part of a cost leadership strategy
The matrix also helps businesses maintain a balanced portfolio. A healthy product portfolio typically includes cash cows generating profits, stars representing future growth, and carefully selected question marks that might become tomorrow's stars.
Real-world application: De Vere case study
To understand how the Boston Matrix works in practice, consider the example of De Vere, a British luxury car manufacturer. The table below shows sales data for their four models:
| Model | Sales – Feb 2012 | Sales – Feb 2013 | Year on year change (%) |
|---|---|---|---|
| P4 | 2,033 | 2,784 | 36.94 |
| P6 | 473 | 337 | –28.75 |
| P7 | – | 79 | – |
| P901 | 943 | 1,201 | 27.36 |
Worked Example: Analysing De Vere's Portfolio
The P4 model shows strong growth of 36.94% and represents the highest sales volume. This suggests it could be classified as either a star (if it has high market share in a growing market) or a question mark (if market share is still being built). The strong growth indicates it deserves continued investment.
The P6 model experienced a significant decline of 28.75%, dropping from 473 to 337 units. This negative performance suggests it may be a dog or a question mark that is failing to gain traction. De Vere needs to evaluate whether this product has any growth potential or should be discontinued.
The P7 model is a new product with only 79 sales in its first year. As a new entrant, it's likely a question mark – operating in a market with uncertain potential. De Vere must monitor this product closely to determine whether it can build market share or whether it will remain unprofitable.
The P901 model shows healthy growth of 27.36%, increasing from 943 to 1,201 units. Like the P4, its classification depends on market share, but the positive growth trend suggests it's performing well and may warrant continued investment.
This analysis demonstrates how the Boston Matrix helps businesses make strategic decisions about product development, marketing investment, and resource allocation based on actual performance data.
Remember!
Key Points to Remember:
- Portfolio analysis is a systematic method of categorising and evaluating all products and services to inform strategic planning and resource allocation decisions
- The two-step process involves first creating a comprehensive overview of all products, then evaluating performance based on sales, costs, competition, and risks
- The Boston Matrix categorises products using two dimensions: market growth rate (vertical axis) and market share (horizontal axis)
- Stars (high growth, high share) require investment to maintain leadership and are the future cash cows
- Cash cows (low growth, high share) generate surplus cash that funds investment in other products
- Question marks (high growth, low share) consume cash but have potential – require strategic decisions about whether to invest or divest
- Dogs (low growth, low share) should typically be sold or discontinued as they offer limited growth prospects
- The matrix helps businesses maintain a balanced portfolio and make informed strategic decisions about market penetration, product development, and divestment