Interpretation of Financial Statements (Edexcel A-Level Business): Revision Notes
Statement of financial position
What is a statement of financial position?
The statement of financial position (also known as the balance sheet) provides a snapshot of a business's financial standing at one specific moment in time. It summarises what the business owns (assets), what it owes (liabilities), and what belongs to the shareholders (capital or equity).
Think of it as a financial photograph taken on a particular date, typically at the end of the financial year.
The statement is called a "balance sheet" because it must always balance - the two sides of the equation (assets on one side, capital plus liabilities on the other) are always equal.
The three key components
Every statement of financial position contains three fundamental elements:
Assets represent everything the business owns and uses in its operations. These resources generate value for the business and fall into two categories:
- Current assets - resources that will be used up or converted to cash within 12 months (e.g. stock, money owed by customers)
- Non-current assets - long-term resources used repeatedly over time (e.g. machinery, buildings)
Liabilities represent what the business owes to others - its debts and obligations. These funding sources also split into two types:
- Current liabilities - debts that must be repaid within 12 months (e.g. overdrafts, supplier credit)
- Non-current liabilities - long-term debts payable after more than one year (e.g. mortgages, long-term loans)
Capital (or equity) represents the money invested by the business owners. For limited companies, this appears as shareholders' equity. Capital serves as another source of funds and can be used to purchase assets.
These three components are interconnected: assets represent what the business uses to operate, liabilities and capital represent how those assets were financed.
The fundamental accounting equation
The statement of financial position must always balance because of this core relationship:
This equation holds true because any increase in assets must be funded by either borrowing more (increasing liabilities) or by owners investing more (increasing capital). Similarly, any reduction in liabilities or capital must lead to a corresponding reduction in assets.
The equation always balances - there are no exceptions.
Worked Example: Understanding the Accounting Equation
Consider a business with:
- Assets: $437.6 million
- Capital: $250.1 million
- Therefore, liabilities must equal: $187.5 million
If this business takes out a $15 million mortgage to purchase a new building:
- Assets increase by $15 million (new building) → $452.6 million
- Liabilities increase by $15 million (mortgage debt) → $202.5 million
- Capital remains unchanged at $250.1 million
The equation still balances:
✓

Structure of a statement of financial position
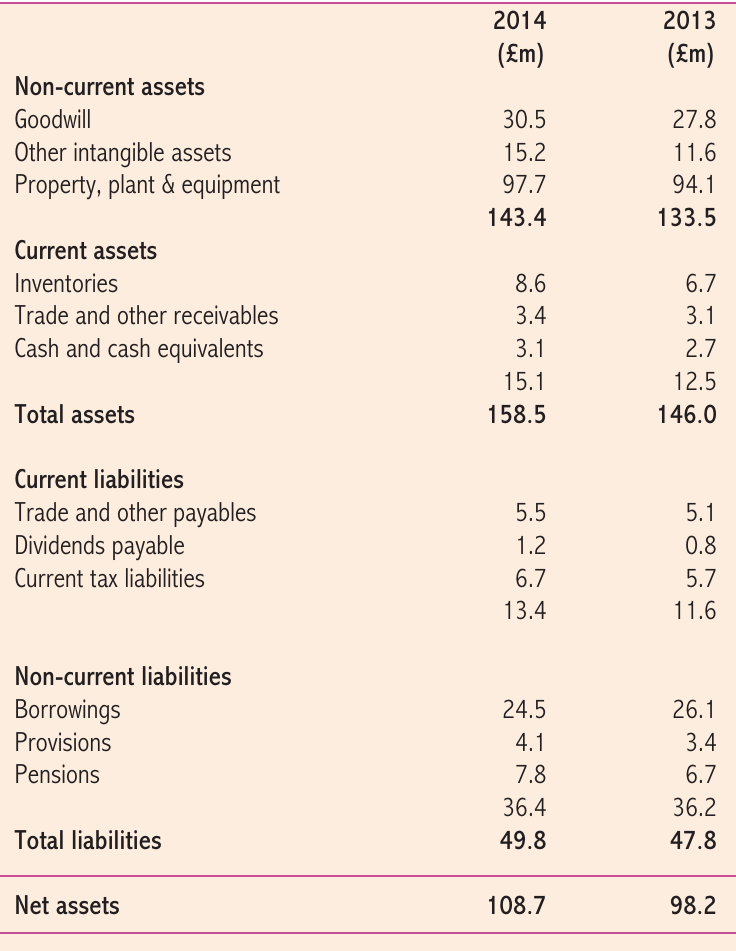
The statement follows a standard format, working from long-term items down to short-term items, then calculating net assets, which equals shareholders' equity. Let's examine each section using WellFed Ltd as our example.
The standard format makes it easier to compare different companies' financial positions and to track changes over time within the same business.
Non-current assets
Non-current assets are resources the business expects to keep for more than 12 months. These long-term assets typically include:
Goodwill is an intangible (non-physical) asset representing the business's value above its net assets. It reflects the company's reputation, customer loyalty, and brand strength. For example, customers who consistently return to a business create goodwill value. WellFed Ltd's goodwill was valued at $30.5 million in 2014.
Other intangible assets include non-physical resources such as:
- Brand names
- Copyrights
- Trademarks
- Patents
These assets have value but cannot be physically touched. WellFed Ltd held $15.2 million of other intangible assets in 2014.
Property, plant and equipment represents the tangible (physical) assets the business owns. These visible resources might include:
- Factory buildings
- Machinery
- Equipment
- Vehicles
- Fixtures and fittings
For WellFed Ltd, a cattle feed producer, this would include their processing facilities and manufacturing equipment, valued at $97.7 million in 2014.
Investments are financial assets owned by the company, such as shares in other businesses. When listed under non-current assets, the business does not plan to sell these investments within 12 months. If investments will be sold within a year, they appear under current assets instead. WellFed Ltd held no investments in 2014.
WellFed Ltd's total non-current assets in 2014: $143.4 million
Current assets
Current assets are liquid resources that either exist as cash or will convert to cash within 12 months. The main categories include:
Inventories (also called stock) consist of:
- Raw materials and components
- Work in progress
- Finished goods ready for sale
For WellFed Ltd, inventory would include grain (barley and wheat), nutrients, and packaging materials. The business held $8.6 million of inventories in 2014.
Trade and other receivables represent money owed to the business, including:
- Trade debtors (customers who bought on credit)
- Prepayments (payments made in advance)
- Any other amounts due within 12 months
WellFed Ltd was owed $3.4 million by debtors in 2014.
Cash at bank and in hand includes:
- Physical cash held on the premises
- Money in bank accounts
- Cash equivalents (very liquid short-term investments)
WellFed Ltd held $3.1 million in cash and equivalents in 2014.
Current assets are listed in order of liquidity - starting with inventories (least liquid) and ending with cash (most liquid). This ordering helps readers quickly assess the business's ability to meet short-term obligations.
WellFed Ltd's total current assets in 2014: $15.1 million
Total assets (non-current + current): $158.5 million
Current liabilities
Current liabilities represent debts the business must repay within 12 months. Common examples include:
Borrowings cover short-term loans and bank overdrafts. These provide temporary financing but must be repaid quickly. WellFed Ltd had no short-term borrowings in 2014.
Trade and other payables include:
- Trade creditors (suppliers offering credit terms)
- Utility bills owed
- Services purchased but not yet paid for
WellFed Ltd owed $5.5 million to suppliers in 2014.
Dividends payable represent profit distributions that the board has declared for shareholders but not yet paid. When the balance sheet is prepared, the company may have decided the dividend amount but not yet transferred the money. WellFed Ltd owed $1.2 million in dividends to shareholders on 31.12.14.
Current tax liabilities include:
- Corporation tax owed by the company
- Employees' income tax collected through PAYE
- Any other tax due within 12 months
WellFed Ltd owed $6.7 million in tax on 31.12.14.
WellFed Ltd's total current liabilities in 2014: $13.4 million
Non-current liabilities
Non-current liabilities are long-term debts that the business need not repay for more than one year. These typically include:
Other loans and borrowings represent money owed for at least 12 months, such as:
- Long-term bank loans
- Mortgages on property
- Debentures
WellFed Ltd owed $24.5 million in long-term borrowings in 2014.
Provisions must be recorded when the company expects to incur future expenditure. These might arise from:
- Contractual agreements
- Product warranties
- Potential bad debts
- Legal claims
Short-term provisions (due within 12 months) appear under current liabilities instead. WellFed Ltd had $4.1 million of provisions in 2014.
Retirement pension obligations represent money the company owes to former employees as pension commitments. WellFed Ltd had $7.8 million of pension obligations in 2014.
WellFed Ltd's total non-current liabilities in 2014: $36.4 million
Total liabilities (current + non-current): $49.8 million
Net assets
Net assets equals total assets minus total liabilities. This figure represents the overall value of the business and always matches shareholders' equity at the bottom of the balance sheet.
For WellFed Ltd in 2014:
$108.7 million
Net assets provide a guide to business valuation, though market value may differ from balance sheet value. The market value of a business often exceeds its net asset value because the balance sheet doesn't capture all sources of value (such as future earning potential or unrecognized intangible assets).
Shareholders' equity
The equity section shows what the business owes to its shareholders. This comprises:
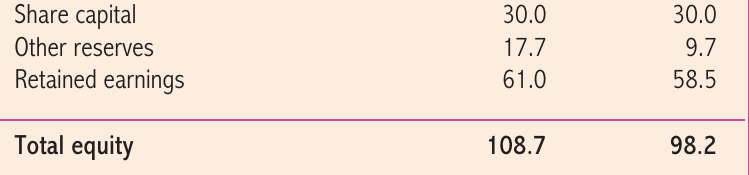
Share capital represents the original amount paid by shareholders when shares were first issued. This figure does not reflect current market value of the shares and is rarely repaid during the company's lifetime. WellFed Ltd's issued share capital in 2014 was $30 million.
Share premium account records the difference between the issue price of new shares and their nominal (face) value.
Worked Example: Calculating Share Premium
- Nominal value per share: $1
- Company issues 2 million new shares at $3 each
- Premium per share: $2
- Total share premium: $4 million
This $4 million would appear in the share premium account.
WellFed Ltd had no share premium in 2014.
Other reserves covers any amounts owed to shareholders not included in other equity categories. WellFed Ltd had $17.7 million of other reserves in 2014.
Retained earnings (identical to retained profit) represents accumulated profit kept within the business rather than distributed as dividends. This money can fund future investment projects and business growth. WellFed Ltd had retained earnings of $61 million in 2014.
Total equity for WellFed Ltd in 2014: $108.7 million
This exactly matches net assets ($108.7 million), which explains why the statement is called a "balance sheet" - it always balances.
Understanding Retained Profit - A Critical Exam Concept
Retained profit appearing in the balance sheet is not cash. It represents accumulated profit owed to shareholders over the business's trading history. Some of this retained profit may have been used to purchase assets.
The actual cash held by the business appears under current assets as "cash at bank and in hand". Only if the company was liquidated would retained profit be returned to shareholders in cash form.
This is one of the most commonly misunderstood concepts in financial accounting.
Comparative figures and analysis
Company law requires published accounts to show both the current year's and previous year's figures. This allows stakeholders to:
- Track changes over time
- Identify trends
- Assess business performance
- Make year-on-year comparisons
Looking at WellFed Ltd's statement, we can compare 2014 with 2013 to evaluate the business's financial position and progress.
Practice application: Completing a balance sheet
When analyzing a statement of financial position, you may need to calculate missing figures using the accounting equation. Remember:
These relationships allow you to work backwards to find missing values. If you know any two of the three main components (assets, liabilities, equity), you can always calculate the third using the fundamental accounting equation.
Key Points to Remember:
-
The statement of financial position (balance sheet) shows what a business owns (assets), owes (liabilities), and is worth to shareholders (equity) at a specific point in time.
-
The fundamental equation must always balance - any change in assets requires an equal change in capital or liabilities.
-
Non-current assets and liabilities involve timeframes longer than 12 months, while current assets and liabilities involve timeframes of 12 months or less.
-
Net assets (total assets minus total liabilities) always equals total shareholders' equity - this is why the statement "balances".
-
Retained profit shown in equity is not cash - it represents accumulated profit owed to shareholders. Actual cash held appears under current assets.