Globalisation and Trade (Edexcel A-Level Economics A): Revision Notes
International Trade
Introduction to specialisation and international trade
International trade has been recognised as crucial for economic growth and development since the time of economists Adam Smith and David Ricardo. During the Industrial Revolution, Britain's ability to import raw materials from its colonies was a key factor enabling its manufacturing growth. Today, consumers in the UK can purchase and use many products that cannot be produced domestically.
The principle of comparative advantage, developed by David Ricardo in the early 19th century, remains one of the most fundamental concepts in international economics. It explains why trade can be mutually beneficial even when one country is more efficient at producing everything.
From an economic perspective, Ricardo demonstrated that nations can benefit from trade through a process of specialisation based on comparative advantage. This principle shows how countries can gain from trading with each other, even when one country might be more efficient at producing everything.
Absolute and comparative advantage
Understanding absolute advantage
When one producer can make a good using fewer resources than another producer, they have an absolute advantage. This concept refers to the ability to produce something more efficiently, typically using less labour or other inputs.
Consider a simple example. Two individuals, Aiden and Ayesha, earn additional income by making pottery and jewellery at weekends. They plan to sell their creations at a local market. Depending on how they allocate their time, they can produce different combinations of these items.
| Aiden | |
|---|---|
| Pots | Bracelets |
| 12 | 0 |
| 9 | 3 |
| 6 | 6 |
| 3 | 9 |
| 0 | 12 |
| Ayesha | |
|---|---|
| Pots | Bracelets |
| 18 | 0 |
| 12 | 12 |
| 6 | 24 |
| 3 | 30 |
| 0 | 36 |
Looking at the production data, Ayesha can produce more of both products than Aiden. If they each devote all their time to one activity, Ayesha makes 18 pots compared to Aiden's 12, or 36 bracelets compared to Aiden's 12. This demonstrates that Ayesha has an absolute advantage in producing both goods. Put simply, Ayesha is more productive than Aiden at both activities.
Understanding comparative advantage
However, absolute advantage doesn't tell the complete story. There is another important consideration: comparative advantage. This refers to the ability to produce a good at a lower opportunity cost than another producer.
The key difference between absolute and comparative advantage is crucial: absolute advantage is about producing more efficiently in absolute terms, whilst comparative advantage is about producing at a lower opportunity cost. It is comparative advantage, not absolute advantage, that determines the potential gains from trade.
The difference becomes clearer when we examine opportunity costs. Although Ayesha produces both goods more efficiently, the difference is much greater for bracelets than for pots. Ayesha has relatively greater proficiency in bracelet production. This means she has a comparative advantage in making bracelets.
Worked Example: Calculating Opportunity Costs
For Ayesha:
- If she switches from pots to bracelets: sacrifices 6 pots for 12 additional bracelets
- Opportunity cost of one bracelet = pots per bracelet
For Aiden:
- There is a one-to-one trade-off between the two products
- Opportunity cost of one bracelet = 1 pot per bracelet
Conclusion: Ayesha has the lower opportunity cost for bracelets (0.5 pots vs 1 pot), so she has the comparative advantage in bracelet production.
For pot production:
- Aiden's opportunity cost: 1 bracelet per pot
- Ayesha's opportunity cost: bracelets per pot
Conclusion: Aiden has the lower opportunity cost for pots (1 bracelet vs 2 bracelets), so he has the comparative advantage in pot production.
The law of comparative advantage
This analysis leads to an important economic principle: the law of comparative advantage. This theory argues that overall production can increase if individuals (or countries) specialise in producing the goods in which they have a comparative advantage.
In the example above, if both Ayesha and Aiden specialise according to their comparative advantages, total output rises. This principle applies equally to international trade between nations.
Gains from international trade
The same principle of comparative advantage operates in international trade. We can apply this concept using a model with certain assumptions. In this model, we assume:
- The goods being traded are homogeneous (identical in quality)
- There are no barriers to trade
- Factors of production are perfectly mobile between sectors
- Participants have perfect knowledge
- There are constant returns to scale
- Transport costs are zero
These assumptions simplify the analysis and allow us to focus on the fundamental principles. In reality, these assumptions may not hold perfectly, but the core principle of comparative advantage remains valid and powerful in explaining trade patterns.
Consider two countries, Anywhere and Somewhere. Assume Anywhere has an absolute advantage in producing both agricultural and manufactured goods. However, suppose that Anywhere faces lower opportunity cost in manufacturing, whilst Somewhere has lower opportunity cost in agricultural production.
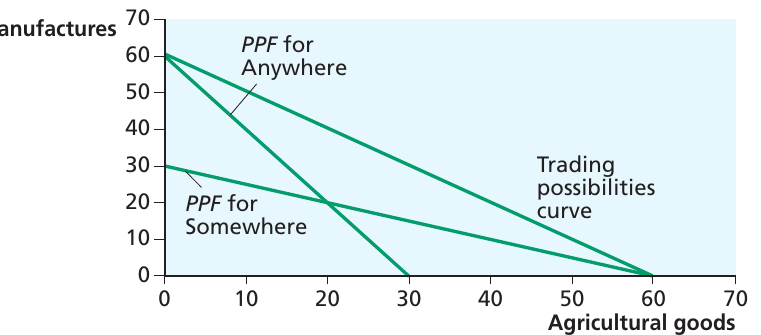
The diagram shows the Production Possibility Frontiers (PPFs) for both countries, along with a trading possibilities curve. Without trade, each country is limited to consuming along its own PPF. For example, if Somewhere wants to consume 20 units of manufactures without trade, it can consume a maximum of 20 units of agricultural goods.
However, if each country specialises in the product where it has comparative advantage and then trades, both can achieve consumption combinations beyond their individual PPFs. Anywhere could produce 60 units of manufactures and Somewhere could produce 60 units of agricultural goods. If trade takes place on a one-to-one basis (one unit of manufactures exchanged for one unit of agricultural goods), the trading possibilities curve shows the potential consumption points available to each country.
This demonstrates how specialisation and trade can expand consumption possibilities for both countries, even though one has an absolute advantage in both products.
Calculating opportunity cost ratios
The key to understanding comparative advantage lies in calculating opportunity cost ratios for each country. This shows the rate at which one good must be sacrificed to produce more of another good.
Worked Example: Comparing Opportunity Cost Ratios
For Anywhere:
- Increasing agricultural output by 10 units requires sacrificing 20 units of manufactures
- Opportunity cost ratio =
- For every unit of extra agricultural output, 2 units of manufactures must be given up
For Somewhere:
- Increasing agricultural output by 10 units requires sacrificing 10 units of manufactures
- Opportunity cost ratio =
Comparing the ratios:
- Opportunity cost for manufactured goods: 0.5 for Anywhere versus 1 for Somewhere
- Opportunity cost for agricultural goods: 2 for Anywhere versus 1 for Somewhere
Conclusion: Anywhere should specialise in manufactured goods (lower opportunity cost of 0.5) and Somewhere should specialise in agricultural goods (lower opportunity cost of 1).
Who benefits from international trade?
Specialisation can increase overall production of goods. However, one fundamental question in economics is: who benefits? It is theoretically possible for exchange to occur in a way that benefits both countries. Whether this actually happens depends on the prices at which exchange takes place.
Risks and concerns about specialisation
Potential Dangers of Over-Specialisation
Specialisation may bring risks as well as benefits. One concern is that by specialising, a country allows certain sectors to decline. This can create vulnerabilities:
- Food security concerns: A country that relies heavily on imported food and permits its agricultural sector to deteriorate could face serious consequences if conflicts or other disruptions interrupt imports
- Strategic sector vulnerability: Loss of essential industries may compromise national security
- Commodity dependency: Over-reliance on particular commodities can be problematic if demand collapses due to technological substitutes or changing preferences
For this reason, many countries implement measures to protect strategic sectors, such as agriculture or other industries seen as essential. This argument was central to the establishment of the Common Agricultural Policy in Europe.
Over-reliance on particular commodities can also be problematic. For example, when artificial substitutes for rubber were developed, this had an enormous impact on natural rubber demand. The price of rubber fell sharply, causing difficulties for countries that had specialised in rubber production. More recently, the conflict in Ukraine exposed European countries' vulnerability, as they depended heavily on importing oil and gas from Russia. Many countries in Africa and the Middle East also experienced problems because of their reliance on importing grain from Ukraine.
The terms of trade
One key factor determining who gains from international trade is the terms of trade. This is defined as the ratio of the index of export prices to the index of import prices.
Suppose both export and import prices are rising over time, but import prices rise more rapidly than export prices. This means the ratio of export to import prices will fall, causing the terms of trade to worsen. In practical terms, this means a country must export a greater volume of goods to acquire the same volume of imports.
Calculating and interpreting the terms of trade
Export and import prices are expressed as index numbers, based on a particular base year. The following example shows how to calculate changes in the terms of trade.
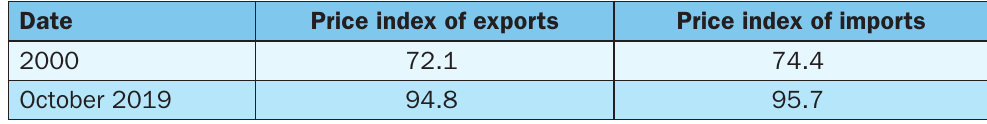
Worked Example: Calculating Terms of Trade
Step 1: Rebase the price indices to October 2019 (2000 = 100)
- Rebased export price index =
- Rebased import price index =
Step 2: Calculate the terms of trade The terms of trade represent the relative price change over the period:
Interpretation: The terms of trade increased by 2.3% between 2000 and October 2019. This indicates that the same volume of exports will purchase a greater volume of imports than in 2000 — in other words, the terms of trade have improved.
When interpreting the terms of trade, note that if the terms of trade index is greater than 100, this means that export prices have increased by more than import prices.
Terms of trade for different countries
Countries experience changes in their terms of trade in very different ways over time. This depends strongly on the pattern of a country's exports and imports.
A fall in the terms of trade indicates that the same volume of exports will purchase a smaller volume of imports than before. A downward movement in the terms of trade is therefore unfavourable for an economy.
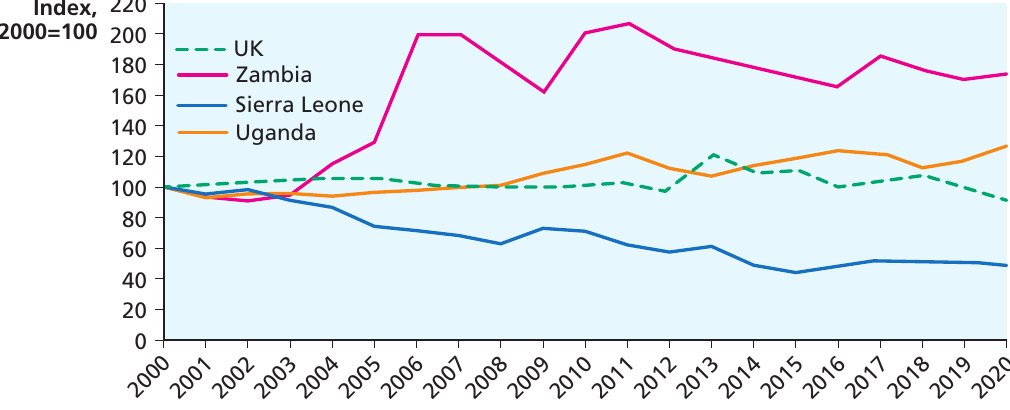
Different countries have experienced varying patterns. For example, Uganda's exports are dominated by coffee, so coffee prices have a strong influence on Uganda's terms of trade. Although the terms of trade fluctuated during this period, they remained relatively stable overall. Zambia's copper exports mean that copper prices significantly affected Zambia's terms of trade. As copper prices increased after 2005, Zambia's terms of trade improved. The UK's terms of trade varied little during this period, relative to Zambia or Sierra Leone.
Income Terms of Trade
The terms of trade are calculated purely with respect to prices, and take no account of changing volumes of trade. In other words, a deterioration in the terms of trade does not necessarily mean an economy is worse off, as long as the volume of trade is increasing sufficiently rapidly.
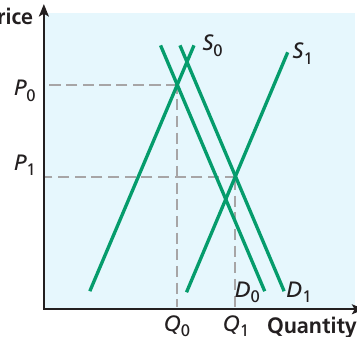
Short-run volatility in commodity prices
For agricultural goods, demand tends to be relatively stable over time, but supply can be volatile due to weather conditions and climatic variations from season to season.
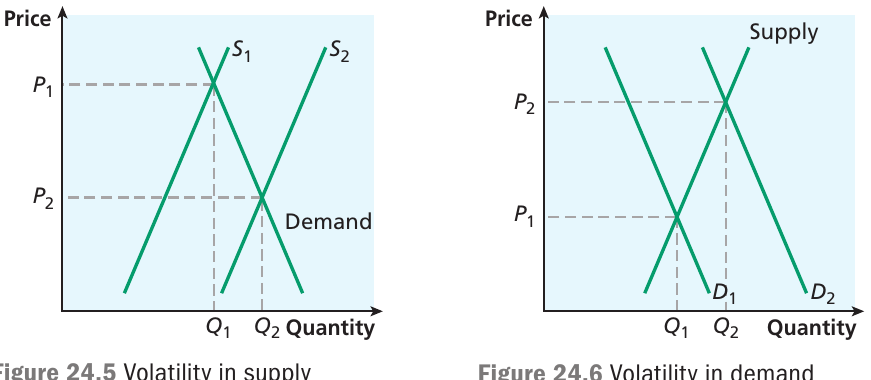
The diagram shows a typical market in two periods. In period 1, the global harvest is poor, with supply given by . Equilibrium is achieved with price at and quantity traded at . In period 2, the global harvest is abundant, so prices fall to and quantity traded rises to .
Notice that in this case, the movement of prices is relatively strong compared with the variation in quantity. This reflects the price elasticity of demand, which is expected to be relatively inelastic for many primary products. From consumers' perspective, demand for foodstuffs and other agricultural goods will tend to be inelastic, as demand will not respond strongly to changes in prices.
For many minerals and raw materials, however, the picture is different. For such commodities, supply tends to be stable over time, but demand fluctuates with the economic cycle in developed countries, which are the importers of raw materials. At the trough of the economic cycle, demand is low (at ), and so the equilibrium price will also be low (at ). At the peak of the cycle, demand is more buoyant (at ), and price is relatively high (at ).
From an individual country's perspective, the result is the same: the country faces volatility in the prices of its exports. From this perspective, it does not matter whether the instability arises from the supply side or the demand side of the market. The problem is that prices can rise and fall quite independently of conditions within the domestic economy.
Instability of prices also means instability of export revenues. If a country relies on export earnings to fund its development path, to import capital equipment or to meet debt repayments, such volatility in earnings can create a severe problem — for example, if export earnings fall such that a country cannot meet its commitments to repaying debt.
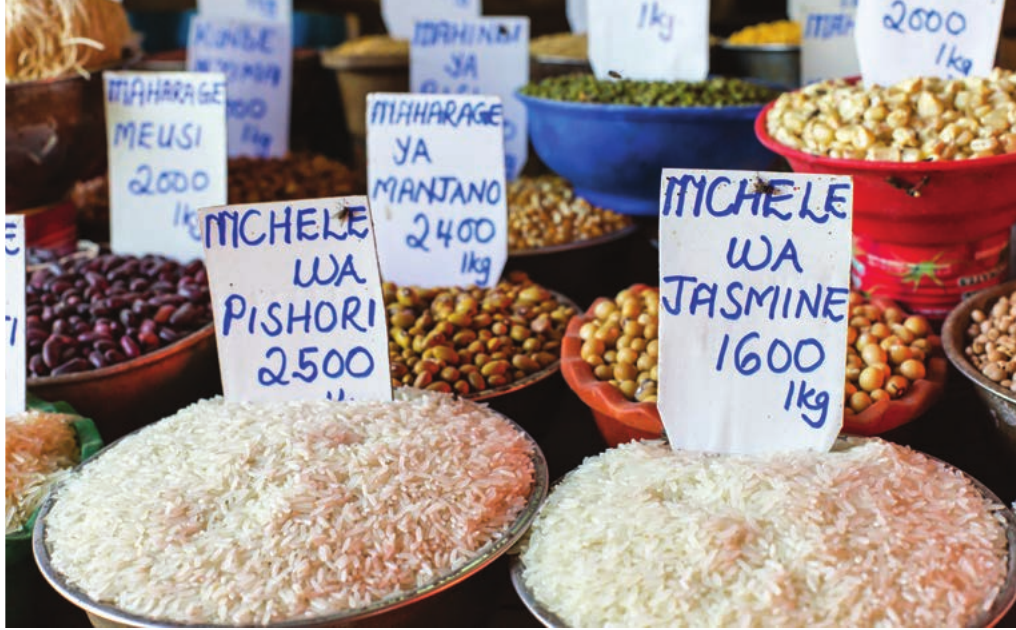
Long-run deterioration in primary product prices
The nature of demand for primary products can be expected to influence the long-run path of relative prices. In particular, the income elasticity of demand is an important consideration.
As real incomes rise in developed countries, the demand for agricultural goods can be expected to rise relatively slowly. Ernst Engel pointed out that at relatively high income levels, the proportion of expenditure devoted to foodstuffs tends to fall and the demand for luxury goods rises. This suggests that demand for agricultural goods shifts relatively slowly through time.
For raw materials, there have been advances in the development of artificial substitutes for many commodities used in manufacturing. Furthermore, technology has changed over time, improving the efficiency with which inputs can be converted into outputs. This has weakened the demand for raw materials produced by developing countries.
Furthermore, if some developing countries are successful in increasing output of these goods, there will be an increase in supply over time. The diagram shows the result of such an increase. Suppose that the market begins with demand at and supply at . Market equilibrium results in a price of and quantity of . As time goes by, demand moves to the right a little to , and supply shifts to . The result is a fall in the price of the commodity to .
It is thus clear that not only may developing countries experience short-run volatility in prices, but the terms of trade may also deteriorate in the long run.
Pattern of comparative advantage
In light of these twin problems, it is perhaps not surprising that many developing countries see themselves as trapped by their pattern of comparative advantage, rather than being able to exploit it. They have therefore been reluctant to continue in a state of dependency on primary products, but the process of diversification into a wide range of products has been difficult to achieve.
Factor endowments and production techniques
Two Swedish economists, Eli Heckscher and Bertil Ohlin, argued that a country's comparative advantage would depend crucially on its relative endowments of factors of production. They suggested that the optimal techniques for producing different commodities varied. Some commodities are most efficiently produced using labour-intensive techniques, whereas others could be more efficiently produced using relatively capital-intensive methods.
The Heckscher-Ohlin Theory
This suggests that if a country has abundant labour but scarce capital, then its natural comparative advantage would lie in the production of goods that require little capital but lots of labour. In contrast, a country with access to capital but facing a labour shortage would tend to have a comparative advantage in capital-intensive goods or services.
Changes in comparative advantage over time
Under these arguments, it would seem to make sense for developing countries to specialise in labour- or land-intensive activities such as agriculture or other primary production. Countries like the UK or the USA could then specialise in more capital-intensive activities such as manufacturing or financial services. By and large, this describes the way in which the pattern of world trade developed.
However, the pattern is not static and there have been changes over time. For example, economies in South East Asia, such as Hong Kong, Singapore and Taiwan, encouraged the structure of their economies to change over time, switching away from labour-intensive activities as their access to capital goods improved. Their success then induced changes in the structure of activity in more developed countries as the availability of imported manufactured goods allowed the expansion of service sector activity.
In more recent years, China's economy has been undergoing even faster structural change, with the rapid expansion of the manufacturing sector, supported by an exchange rate policy that made its exports highly competitive in global markets.
Whether it is beneficial for countries to rely on this pattern of natural comparative advantage is debatable — for example, in light of the changing patterns of relative prices reflected in the evolution of the terms of trade over time. Over-specialisation can result in unbalanced development, which can create vulnerability.
This suggests there may be potential for countries to seek to alter the pattern of their comparative advantage by diversifying their economies and developing new specialisms in response to changing patterns of global consumer demand.
The pattern of world trade
To provide context for discussing the effect of globalisation on trade, and the place of the UK economy in the global economy, it is helpful to examine the pattern of world trade.
World trade in goods and services increased steadily throughout the period since 1970. Notice that imports would show an almost identical picture, as one country's exports are imports to other countries. The pattern is clear: world trade increased steadily throughout the period, with just a couple of temporary interruptions — one at the time of the global financial crisis in 2008/09, and the other at the time of the COVID-19 pandemic. This provides the backdrop for discussing trade patterns.
Trade flows between developed and developing countries
Trade flows between developed countries — and with some of the more advanced developing countries — have dominated world trade, with flows between developing countries being relatively minor. In 2019, exports from high-income countries made up 69.5% of total world exports. In contrast, exports from low-income countries only contributed 0.36%.
This is not surprising, given that by definition the richer countries have greater purchasing power. However, the degree of openness to trade varies between economies around the world as a result of conscious policy decisions. Some countries, especially in East Asia, have adopted very open policies towards trade, promoting exports to achieve export-led growth. In contrast, some countries (including a number in Latin America) have been much more reluctant to become dependent on international trade, and have adopted a more closed attitude towards trade.
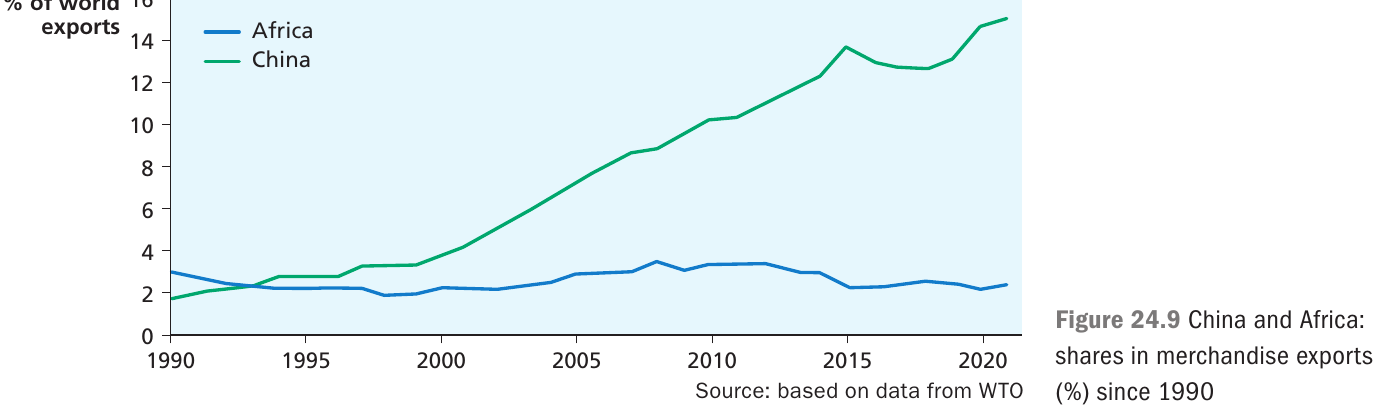
The rise of China and Africa's role
The emergence of China as a major exporting power has changed the landscape of world trade. In 1982, China contributed just 1.04% of world exports of goods and services. In 2020, China's share had reached 12.13%. This has had repercussions for countries around the world.
At the same time, Africa's involvement in international trade has remained low relative to its population. This pattern is shown in the following figure, which shows the share of China and Africa in world merchandise exports since 1990.
UK trade patterns
The UK's share of world trade has been in decline for a long time.
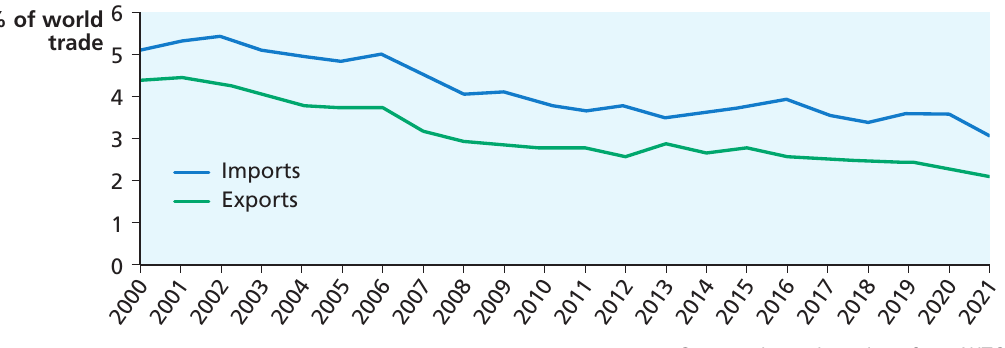
The figure shows the UK's share of merchandise imports and exports since 2000. Notice that over this period, imports consistently exceeded exports, contributing to a deficit on the current account of the balance of payments.
UK trade with the European Union
A significant aspect of the pattern of UK trade has been trade with the European Union. The proportion of UK trade (both exports and imports) with Europe has undergone substantial change over the past 50 years.
In 1960, when the Commonwealth was still thriving and the UK was ambivalent about European integration, less than a quarter of UK exports went to other European countries (23% of exports of goods in 1960). After the UK joined the EU in 1973, the proportion of exports going to the EU rose to more than half. However, in more recent decades there has been a decline.
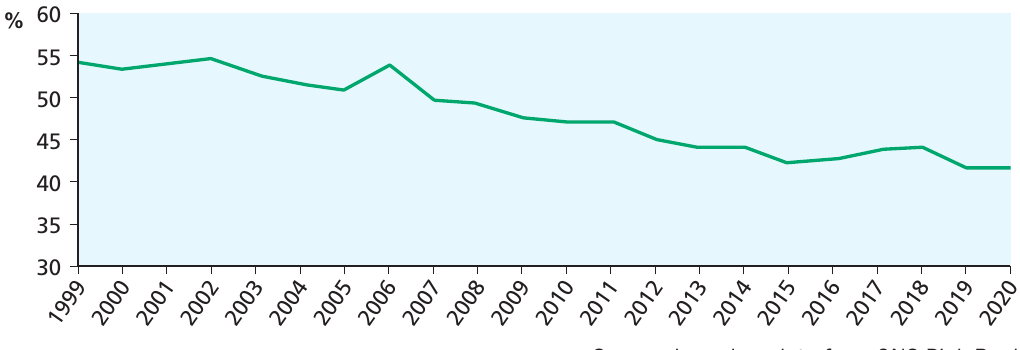
The decline in the share of UK exports to the EU began well before Brexit, reflecting changing global trade patterns and the rise of other trading partners, particularly in Asia and North America.
UK trading partners
Given this decline, with which countries does the UK conduct its trade?
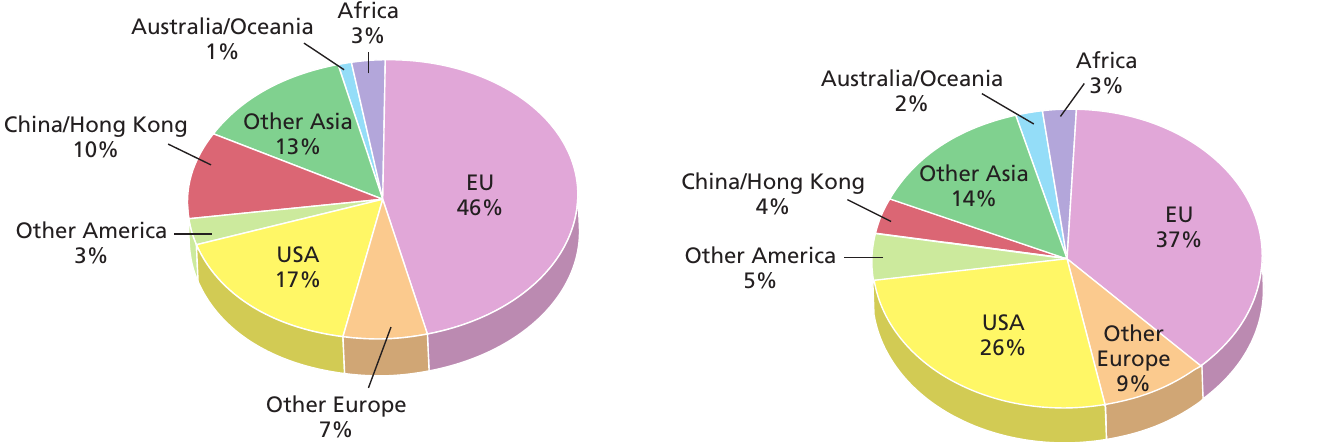
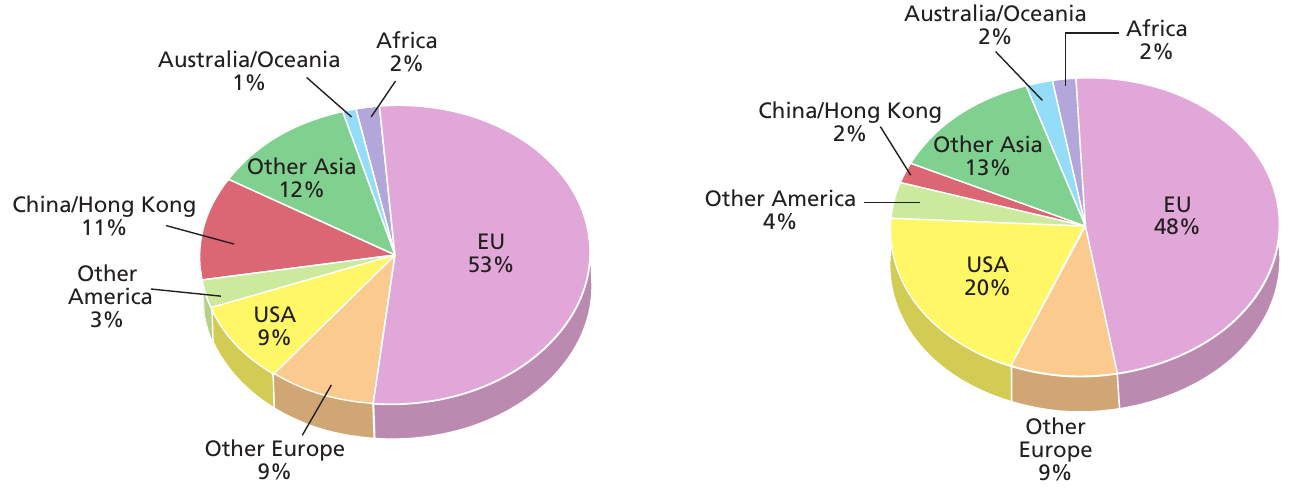
The figures show the destination of UK exports of goods and services, and the source of UK imports. The most striking feature is the extent to which the UK relies on Europe and the USA as destinations for 70% of its exports. A similar pattern appears for UK imports of goods and services. China (including Hong Kong) has become a significant partner in UK trade in goods (both exports and imports).
The emerging economies
Industrialisation and economic growth began in the UK and other countries in western Europe and North America. By the 1960s there was a divide between those countries that had gone through the development and growth process and those that had not. Since the 1960s, relatively few countries have managed to bridge the gap in living standards.
Newly industrialised countries (NICs)
There was a group of countries that made the transition, becoming known as the newly industrialised countries (NICs). These included some economies in South East Asia, such as Singapore, South Korea, Taiwan and Hong Kong, and some Latin American countries, although the latter group fell foul of hyperinflation, which interrupted their progress.
Emerging economies
More recently, some other countries have accelerated in terms of economic growth and human development; they have become known as the emerging economies. This group has included the so-called BRIC countries (Brazil, Russia, India and China), and a less defined group including Thailand, Malaysia, Turkey and South Africa, among others. These economies (especially China) have had a significant effect on the global economy.
The BRICS countries
In the early 2000s, a group of countries — Brazil, Russia, India and China — were identified as experiencing rapid economic growth and closing the gap with developed economies. The BRIC economies were originally just a set of countries identified as having some characteristics in common. However, they began forming a political group and having summit meetings, and in 2011 they invited South Africa to join them.
At this point, the BRICS countries (as they were now called) accounted for about 18% of world GDP and 15% of world trade, and contained about 40% of the world's population. If economic growth were to continue at these relative rates, the group would gain increasing economic and political influence relative to the G7.
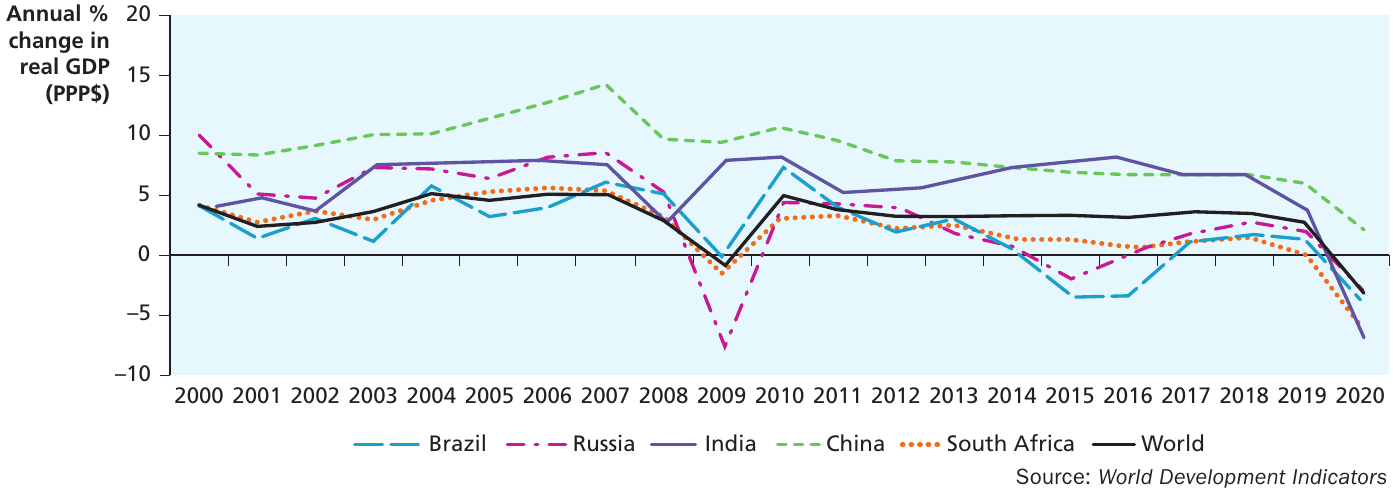
The figure shows economic growth in the BRICS countries since 2000, with the growth rate for the world as a whole to provide context. The consistency and rapidity of growth during the 2000s reveals why these countries were singled out for attention, although Brazil and South Africa were perhaps less successful in terms of their growth rates.
What makes this performance particularly striking is the size of these economies, in terms of both population and GDP. The achievements of the economies of China and India are especially impressive, in each case starting from a relatively low base. For these two economies, the growth seemed relatively robust in the face of the global recession. China in particular showed very little sign of slowing down.
However, the factors underlying the growth performance were different in each case, as these economies are all at very different stages in terms of average incomes and they display different characteristics, both politically and economically. Also visible in the graph is the impact of the COVID-19 pandemic in 2020, affecting all of the BRICS countries.
These countries, together with some other rapid-growth economies, had a significant impact on the global economy, most obviously in the case of China, which in 2014 overtook the USA as the world's biggest economy based on GDP in PPP$.

Impact on the global economy
The impact on the global economy has been evident in many ways. China's growth was built on rapid growth of exports, which for at least part of the period was supported by China's exchange rate, maintained at a level that made China's exports highly competitive overseas.
A number of the Asian emerging economies also accumulated reserves of US Treasury securities during the 2000s, which had the effect of allowing lower US interest rates than would otherwise have been the case. This in turn encouraged consumer borrowing, and may have contributed to the financial crisis.
Of course, China also needed to import goods to fuel its production process, with a consequent impact on commodity prices in global markets. The net effect of these factors is quite difficult to evaluate, but it could be argued that without China's continuing growth through the period of recession following the financial crisis, the slowdown would have been longer-lived.
What factors influence the pattern of trade?
Comparative advantage
Different countries display different patterns of comparative advantage, which then determine the products in which they can specialise to reap potential gains from trade. Advanced countries will tend to have a comparative advantage in capital-intensive or hi-tech products, whereas developing countries are more likely to specialise in land- or labour-intensive production.
Emerging economies
The rise of the emerging economies (including the BRICS) has altered the pattern of trade between countries. These economies have moved into sectors that were previously the province of advanced economies, whilst the advanced economies have shifted into service activities, especially financial and professional services.
Trading blocs and trading agreements
The proliferation of trading blocs has also influenced the pattern of international trade. Changes were heralded by the UK's Brexit move and by the US renegotiation of NAFTA during Trump's presidency. The invasion of Ukraine by Russia has also had a far-reaching impact on the pattern of international trade.
Relative exchange rates
Changes in relative exchange rates affect the prices at which products trade internationally, and influence the potential division of the gains from trade via the terms of trade. However, exchange rates will tend to adjust to maintain relative international competitiveness when countries operate a floating exchange rate system (as most countries do).
Economics in the real world: international trade and the COVID-19 pandemic
Case Study: COVID-19 Impact on International Trade
The COVID-19 pandemic had an unprecedented impact on economies throughout the world, not least being the impact on international trade. In the early stage of the pandemic, the impact on trade was most significant in the trade for medical supplies, especially in relation to products for prevention, testing and treatment.
According to the World Trade Organization (WTO), medical products in normal times comprise about 5% of total world trade. The USA, Germany and China account for 34% of world imports of medical goods; Germany, the USA and Switzerland supply 35% of medical products to the world. The top 10 exporters supply almost three-quarters of world exports of these goods.
As the pandemic developed in early 2020, it soon became apparent that some countries (such as Germany) were better prepared for dealing with a pandemic than others, and there was a widespread global shortage of the protective equipment necessary for medical staff treating COVID-19 patients.
Members of the WTO face rules about the imposition of quantitative restrictions on exports of particular goods, but temporary prohibitions are permitted under Article XI of the GATT 'to prevent or relieve critical shortages of foodstuffs or other products essential to the exporting [member]'. Some countries faced with serious domestic shortages of protective equipment took advantage of this and restricted exports to secure supplies for their own citizens. By April 2020, some 80 countries were thought to have imposed such prohibitions, although this only includes countries that had formally notified the WTO that they were in place.
Such measures are likely to have economic effects. In particular, relative domestic and world prices are likely to be affected, and protectionism would be expected to reduce the extent to which countries are prepared to work collaboratively.
One response could be that countries would begin to develop local capacity to produce. In the long run, this could have the effect of reducing global trade interdependencies. It could also be that in order to allow new activities to survive and grow, some countries would raise tariffs to protect those infant industries. Other countries could then react by imposing export restrictions of their own.
As the pandemic developed, there was a search for treatments and vaccines. This also produced temptation for countries to adopt protectionist attitudes. For example, in the USA a company produced a treatment that was effective in shortening hospital stays for COVID-19 patients. The USA promptly secured the entire supply for a 3-month period. The losers from this kind of protectionism are likely to be the many less developed countries that find themselves struggling to contain the virus.
Key Points to Remember
-
Comparative advantage drives trade: Even if one country has an absolute advantage in producing all goods, both countries can benefit from trade if they specialise based on comparative advantage (lower opportunity cost).
-
Terms of trade matter: The terms of trade measure the ratio of export prices to import prices. Improving terms of trade mean a country's exports can buy more imports, whilst deteriorating terms of trade require more exports to purchase the same volume of imports.
-
Primary product prices are volatile: Agricultural goods face short-run price volatility due to supply fluctuations, whilst raw materials experience volatility due to demand changes linked to economic cycles. Many developing countries also face long-run deterioration in their terms of trade.
-
World trade is concentrated: Trade flows between developed countries dominate world trade. China has dramatically increased its share of world exports (from 1% in 1982 to over 12% in 2020), whilst Africa's participation remains low relative to its population.
-
The UK's trade patterns are changing: The UK's share of world trade has declined over recent decades. Trade with the EU has decreased from over 50% in the early 2000s to around 42% by 2020, with the USA, China and other Asian countries becoming increasingly important trading partners.