Causes of Inequality and Poverty (Edexcel A-Level Economics A): Revision Notes
Causes of Inequality and Poverty
Inequality emerges from multiple sources, including patterns of wealth accumulation, the functioning of labour markets, and the actions of governments. Demographic shifts in the population also play an important role in shaping inequality levels within societies.
The distribution of wealth
One of the most significant ways that wealth affects inequality is through inheritance. When wealth accumulates within a family over time and passes to future generations, this creates a source of inequality that exists independently from current economic conditions or market operations.
Understanding Income vs Wealth
Income represents a flow of money that households receive during each time period (e.g., monthly salary of $3,000).
Wealth represents a stock—the total value of assets that a household owns at any given moment (e.g., house worth $300,000, savings of $50,000, investments of $100,000 = total wealth of $450,000).
The key difference: income is earned over time, while wealth is the accumulated total of assets at a specific point in time.
During 2018-20, households in the highest 10% were estimated to own 43% of identified wealth in the UK, whilst the bottom 50% of households owned only 9%. The Gini coefficient for total wealth in 2020 stood at 60%, considerably higher than the 36% figure for income. This indicates that wealth distribution is far less equal than income distribution.
The Gini coefficient measures inequality on a scale from 0 to 100%, where 0 represents perfect equality and 100% represents maximum inequality. The UK's wealth Gini of 60% compared to income Gini of 36% reveals that wealth is distributed much less equally than income.
The ownership of wealth has important implications for income inequality. Assets generate income flows through interest, rents, and profits, which feed back into a household's income stream.
Home ownership and house prices
A major shift in asset ownership patterns in recent decades has been the growth in home ownership combined with rising house prices. For those who rent their homes, particularly council tenants, this represents a significant source of increasing inequality.
Asset ownership in developing countries
Developing countries face considerable inequality in asset distribution. Financial markets are much less developed than in advanced economies, and many people, especially in rural areas, lack access to formal financial institutions. This inevitably creates concentration in the ownership of financial assets.
Land ownership is highly concentrated in some countries, particularly in Latin America. This has contributed to the relatively high inequality levels that characterise that region. The situation is worsened by weak property rights in many developing countries. Even when a household has farmed land for generations, it may struggle to demonstrate legal ownership rights. Such inequality in asset ownership leads directly to inequality in income distribution.
Labour market explanations
Several features of labour markets contribute to earnings inequality. Inequality can arise from demand and supply conditions, from changes in consumer demand patterns, and from shifts in international comparative advantage. Differences between occupations and economic sectors further reinforce income inequalities.
Structure of employment
Changes in the structure of the economy can increase inequality between certain groups. When employment shifts away from unskilled jobs towards occupations requiring higher skills and qualifications, this can raise inequality levels. Workers lacking the skills to adapt to changing labour market conditions face disadvantages.
If the skills premium rises—meaning employers are willing to pay more to hire skilled or well-qualified workers—then those without such skills are likely to suffer. The decline in trade union power may have contributed to this situation. Low-paid workers may find their unions less able to offer employment protection. However, increased flexibility in labour markets can also bring benefits, and a balance is needed between worker protection and flexible markets.
The decline in trade union power has particularly affected low-paid workers, who may find their unions less able to offer employment protection. This has contributed to widening wage gaps between skilled and unskilled workers.
Wage gap
The earnings difference between female and male workers remains a persistent feature of labour markets. In the UK, female workers on average earn 14.3% lower wages than males (based on male median wage). This represents a smaller gap than in the USA, where females receive wages 16.9% below males. However, the gap is much larger than in some other countries such as Italy (7.6%) or Denmark (5.0%).
Research by the Institute for Fiscal Studies showed that the UK wage gap has fallen for female workers whose highest educational attainment was at GCSE level, but has remained relatively constant for women with A-level or degree-level qualifications since the 1990s.
One explanation for continuing differences between men and women relates to career breaks for childcare. When women take time away from working to look after children, they lose human capital by missing work experience. However, such market explanations may not account fully for all observed earnings differences.
Underdeveloped labour markets
Many developing countries have inefficient and underdeveloped labour markets, which can generate income inequalities. This particularly contributes to inequality between rural and urban areas.
In many countries, rural areas remain highly dependent on subsistence agriculture with relatively low wage labour. The modern sector, located primarily in urban areas, demonstrates higher wage levels and a more formal structure—but with limited job opportunities. This creates substantial migration from rural to urban areas, attracted by wage differentials between regions.
The labour market in many developing countries becomes structured into three segmented sections:
- Rural sector: Subsistence agriculture with low wages
- Urban informal sector: Unregulated businesses and casual work
- Urban formal sector: Regulated employment with higher wages but limited opportunities
Limited linkages between these sectors may perpetuate inequality.
However, given limited formal urban sector job opportunities, the result may be high urban unemployment, combined with congestion and overcrowding. High migration rates may also lead to development of an urban informal sector. Limited linkages between the three sectors may then perpetuate inequality.

Demographic change
Many developed countries have experienced a shift in their age structure in recent years. Improved medical drugs and treatments mean people are living longer. This has combined with low fertility rates to increase the proportion of the population in older age groups.
This demographic shift puts pressure on pension provision and increases the vulnerability of older groups in society. State pensions have been funded primarily by contributions from those in work. If the number of working-age people falls as a proportion of the whole population, then this funding stream comes under pressure.
Government intervention
In developed countries, government intervention affects income distribution in several ways, though not all interventions are specifically designed to do so. The most prominent tools are transfer payments and taxation systems.
The overall impact of these measures has a substantial effect on income distribution. This can be shown using a Lorenz curve, which illustrates how tax and benefit measures bring the distribution closer to the equality line.
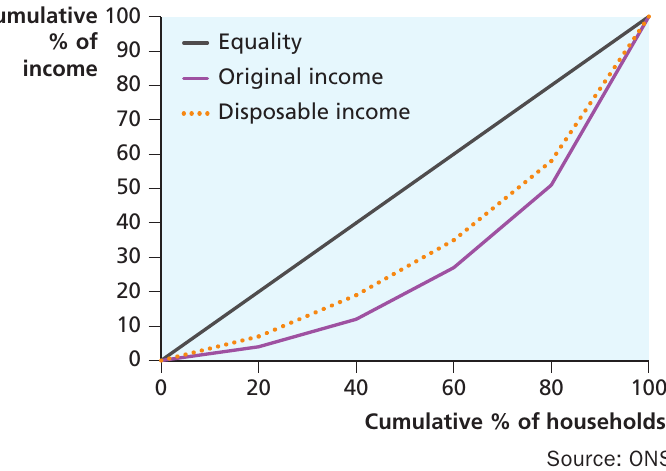
Original income refers to income before any adjustment for taxation or benefits. Disposable income refers to income after taxes and benefits are accounted for. The diagram shows how government intervention moves the Lorenz curve closer to the line of perfect equality.
Benefits
Two main forms of benefit help equalise income distribution:
-
Cash benefits include universal credit, child benefit, and incapacity benefit. These protect families whose income would otherwise be very low in certain circumstances.
-
Benefits in kind include health and education services. These accrue to individual households depending on household composition, age, and gender.
Cash benefits are more important in influencing income distribution. For the lowest quintile (bottom 20% of households), such benefits make up about three-fifths of growth in income and are also significant for the second quintile.
Taxation
Direct taxes
Direct taxes are taxes levied directly on income. They tend to be progressive, meaning higher income groups pay tax at a higher rate.
In the UK, main direct taxes include:
- Income tax
- Corporation tax (paid by firms on profits)
- Capital gains tax (paid by individuals who sell assets at a profit)
- Inheritance tax
- Petroleum revenue tax (paid by firms operating in the North Sea)
- Council tax (collected by local authorities)
- National Insurance contributions (NIC)
Key Definitions:
Direct tax: a tax levied directly on income
Marginal tax rate: tax on additional income, defined as the change in tax payments due divided by the change in taxable income
Progressive tax: a tax in which the marginal tax rate rises with income, i.e. a tax bearing most heavily on the relatively well-off members of society
With income tax, its progressive nature is reflected in how the tax rate increases as an individual moves into higher income ranges. The marginal tax rate increases as income increases. This progressive nature helps reduce inequality in income distribution, though its effect is less than that of cash benefits.
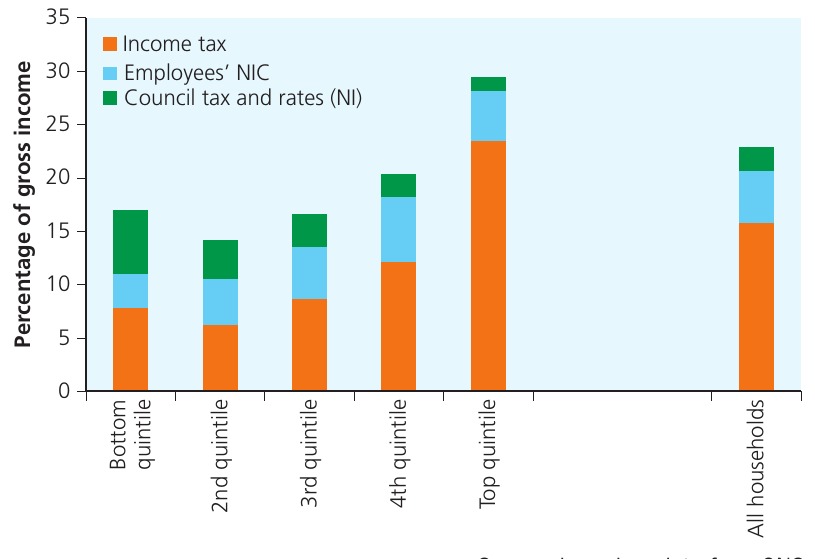
The chart shows average direct tax rates for households by quintile group in 2019/20. Income tax is progressive, with the average tax rate increasing from 7.8% in the bottom quintile to 23.6% in the top quintile. However, council tax is not progressive, taking a higher percentage from the bottom quintile than from the top.
How Progressive Taxation Works
The following table illustrates how a progressive tax system operates:
| Income | Tax paid |
|---|---|
| £1,000 | £100 |
| £2,000 | £300 |
| £3,000 | £600 |
| £4,000 | £1,000 |
As income doubles from £1,000 to £2,000, tax paid triples from £100 to £300. As income increases further, the tax burden grows at an even faster rate. This demonstrates the progressive nature of the system, where higher earners pay a higher proportion of their income in tax.
Indirect taxes
Indirect taxes, on the other hand, can sometimes be regressive. These taxes fall more heavily on lower-income households. Indirect taxes are levied on items of expenditure rather than on income.
Key Definitions:
Indirect tax: a tax on expenditure
Regressive tax: a tax bearing more heavily on the relatively poorer members of society
Proportional tax: a tax that is proportional to income, neither regressive nor progressive
Examples of indirect taxes include:
- Value Added Tax (VAT), charged on most goods and services sold in the UK
- Tobacco taxes
- Excise duties on alcohol and oil
These specific taxes are levied when goods are sold. When demand is price inelastic, producers can pass much of a tax rate increase on to consumers. When demand is price elastic, they must absorb most of the increase as part of their costs.
Tobacco taxes provide a clear example of regressive taxation. The number of smokers is higher among lower-income groups than among the relatively rich. Research shows only about 10% of people in professional groups smoke compared with nearly 40% in unskilled manual groups. Additionally, expenditure on tobacco takes a lower proportion of income for the rich compared with the poor, even for those in the former group who do smoke.
In 2019/20, indirect taxes accounted for 30.4% of disposable income for households in the bottom quintile, compared with 11.1% for households in the top quintile. The largest component was VAT, which accounted for 13.4% of disposable income for bottom quintile households, compared with 5.5% for the top quintile.
A tax that is simply proportional to income would be neither regressive nor progressive, but would be charged at the same percentage rate to all taxpayers.
The balance of taxation
Achieving a balance between direct and indirect taxes is an important aspect of government redistributive policy. A switch in the balance from direct to indirect taxes will tend to increase inequality in a society.
A switch from direct taxes (which are progressive) to indirect taxes (which can be regressive) will tend to increase inequality in a society. The balance between these tax types is crucial for effective redistributive policy.
When Margaret Thatcher came to power in 1979, one of her government's first actions was to increase indirect taxes whilst introducing cuts in income tax. An important part of the rationale was that high marginal tax rates on income can have a disincentive effect. If people know that a large proportion of any additional work will be taxed away, they may be discouraged from providing more work. Cutting income tax can encourage work effort by reducing marginal tax rates.
This highlights the need for balanced policy that recognises that whilst some income redistribution is needed to protect the vulnerable, disincentive effects may arise if better-off groups are over-taxed. It is also important to be aware that disincentives may affect low-paid workers if after-tax pay falls below the level of available social security benefits.
Long-term policy
Economic analysis of inequality causes suggests that some long-term measures can be taken to reduce future inequality, though they may take time to become effective. Policies that encourage greater take-up of education and provide skills retraining may be important in the long run. This ensures that unskilled workers are not excluded from the benefits of economic growth.
Capitalism and inequality
To some extent, it could be argued that some inequality is inevitable within a free-market capitalist society. Indeed, without some inequality, capitalism could not operate. It is the pursuit of gain that provides firms with the incentive to maximise profits, workers with the incentive to provide labour effort, and consumers with the incentive to maximise their utility.
The combination of these efforts by economic agents leads to good resource allocation through the working of Adam Smith's 'invisible hand'. In a world where every individual was guaranteed the same income as everyone else, there would be no incentive for anyone to strive to do better.
Some inequality is necessary in capitalism to provide incentives for economic agents. The pursuit of gain motivates firms to maximise profits, workers to provide labour effort, and consumers to maximise utility. These combined efforts lead to efficient resource allocation.
However, few would argue for complete equality of income. More important is that there should be equality of opportunity.
The impact of COVID-19
A study by the Treasury published in July 2020 explored data on the distribution of incomes of working households by quintile. This highlighted the impact of measures taken in the early months of the COVID-19 pandemic, including the furlough scheme and other steps taken to mitigate the pandemic's impact. The study found that the scale of losses for working households had been reduced by up to two-thirds. However, this data only covered up to May 2020.
More recent data released by the ONS in March 2022, based on results from the Household Finances Survey, suggested that income distribution had not changed significantly across the pandemic. The Gini coefficient was seen to have fallen from 35.4% in 2020 to 34.4% in 2021.
The pandemic likely had different effects on different household types. Households relying on unskilled work in the manufacturing industry may have had fewer opportunities to continue working compared with office workers able to work from home. Retired households may have seen little impact on pensions.
The pandemic's impact varied significantly by household type:
- Manufacturing workers: Fewer opportunities to continue working
- Office workers: Able to work from home with less disruption
- Retired households: Little impact on pensions
The situation of many households was compounded by rises in cost of living that accelerated during the war in Ukraine.
The situation of many households was compounded by rises in cost of living that accelerated during the war in Ukraine. The long-term effects of these complex changes may take time to work their way through the system.
What remains uncertain is how developing countries will emerge from the dual impact of the COVID-19 pandemic and the war in Ukraine. There is some evidence that the pandemic had a greater impact in terms of deaths per head of population in rich countries compared with poorer countries, but more evidence needs to accumulate before this can be confirmed.
The impact of economic growth on global inequality
Weak institutions and poor governance in developing countries mean that measures such as taxation and transfers to influence income distribution are largely untried or ineffective. The economist and Nobel laureate Simon Kuznets argued that there is expected to be a relationship between the degree of inequality in income distribution and the level of development that a country has achieved.
He claimed that in the early stages of economic development, income is fairly equally distributed, with everyone living at a relatively low income level. However, as development begins to take off, some individuals will be at the forefront of enterprise and development, and their incomes will rise more rapidly. In this middle phase, income distribution will tend to worsen. At a later stage of development, society will eventually be able to afford to redistribute income to protect the poor, and all will begin to share in the benefits of development.
The Kuznets Hypothesis
The Kuznets hypothesis suggests an inverted U-shaped relationship between development and inequality:
Stage 1 (Early development): Income is fairly equally distributed at low levels—everyone is relatively poor.
Stage 2 (Middle development): Some individuals become entrepreneurs and their incomes rise rapidly—inequality increases.
Stage 3 (Advanced development): Society can afford to redistribute income to protect the poor—inequality begins to decrease.
This creates an inverted U-shape when plotting the Gini coefficient against GNI per capita.
This can be portrayed as a relationship between the Gini coefficient and the level of development. The thrust of the Kuznets hypothesis is that this should reveal an inverted U-shaped relationship.
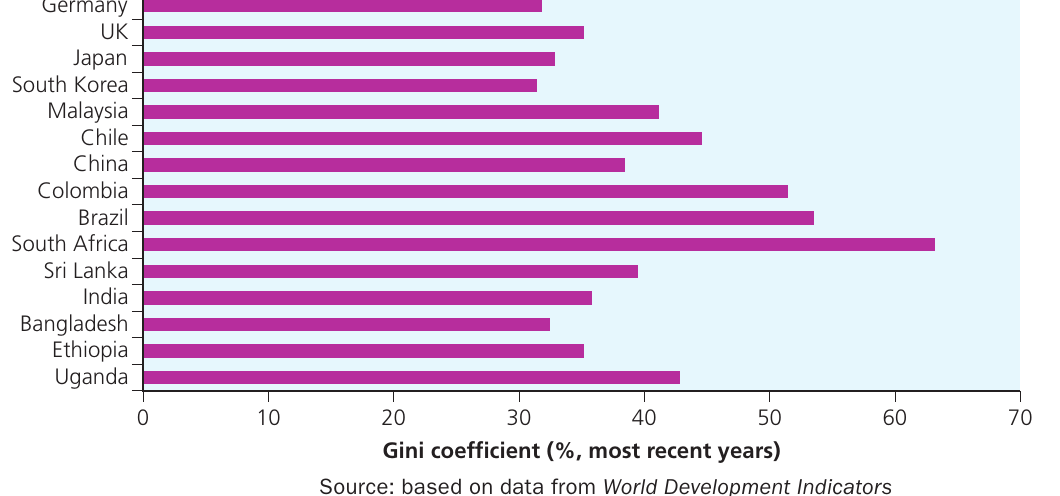
The chart shows the Gini coefficient across a range of countries ranked by level of development (GNI per capita). The pattern suggests there may be some evidence that countries in the middle range of GNI per capita have higher Gini values, but the evidence is not strong.
Empirical support for the Kuznets hypothesis is rather weak. One reason is that the relationship may not show up clearly in cross-section data (evidence based on looking at how relationships vary across countries at a single point in time). Looking at how relationships change through time for individual countries might be more revealing, but data on inequality is expensive to compile and not collected on a regular basis.
It is also worth noting that there are substantial regional variations in the degree of inequality. Latin America has been known for wide inequality between groups in society, whereas eastern Europe has shown much lower levels of inequality, partly because inequality was low across the Soviet bloc. This may conceal the underlying Kuznets relationship.
Case study: Inequality and economic growth in Rio de Janeiro
If you visit Rio de Janeiro, you may see high metal fences in front of many luxurious multi-storey buildings along the lovely beaches of Copacabana. Rio has one of the highest crime rates in Brazil, exacerbated by the high level of income inequality.

It is not uncommon to find a substantial gap between the rich and the poor in many societies. Inequality exists in both developing and developed countries. Nobel laureate Paul Krugman has noted that the 13,000 richest families in the USA have almost as much income as the 20 million poorest households; those 13,000 families have incomes 300 times that of average families.
The level of income inequality depends primarily on the distribution of assets and wages, as well as on government policy. An important factor is the distribution of productive assets such as land. If land ownership is concentrated among a few wealthy landowners, then income inequality tends to be high. Additionally, if ownership of minerals and natural resources is concentrated among the elite of rich countries and endowed with natural resources, these resources—especially mineral resources such as oil, diamonds, and copper—tend also to have higher asset and income inequality.
Another factor explaining variations across countries is the rural-urban inequality within developing countries, which results from urban bias. Overall, income inequality depends largely on earnings inequality. In some countries, rising wage inequality has often been ascribed to technological change. New technologies generate a demand for skills, favouring higher-skilled workers over lower-skilled ones and leading to increasing wage differentials between skilled and unskilled workers.
How Inequality Affects Economic Growth
More unequal societies tend to develop larger groups of people who are excluded from economic opportunities that others enjoy. Poor people may not have the same chances in life as richer people, and may thus never quite realise their full productive potential. This may be because they:
- Do not receive as good an education as those afforded by richer families
- Cannot get loans to start up a business as easily
- Cannot afford insurance they would need to undertake risky but productive ventures
An income distribution with lots of poor people, or unequally distributed opportunities, would under-utilise aggregate productive potential to a greater degree than a distribution with relatively fewer poor people.
The impact on growth may also be negative when the gap between the rich and the poor widens excessively. For instance, rural economies with very high land concentration in a few hands and landlessness for the majority face very high shirking and supervision costs. For these reasons, these economies tend to be less efficient (e.g., to have lower yields per hectare) than more equitable agrarian systems, even when accounting for economies of scale in marketing, processing, and shipping which benefit larger farms.
High levels of income inequality can also create political instability and social problems and negatively affect growth over both the short and long term. There is increasing evidence of a strong relationship between inequality and crime rate. Income differences between households create psychological stress for the relatively poor that may explain higher morbidity, mortality, and violence rates. Social tensions may erode the security of property rights, augment the threat of expropriation, drive away domestic and foreign investment, and increase the cost of business security and contract enforcement.
Key Points to Remember:
-
Inequality arises from multiple sources, including patterns of wealth ownership, labour market operation, demographic changes, and government actions.
-
Wealth distribution is more unequal than income distribution. In the UK, the Gini coefficient for wealth (60%) is much higher than for income (36%). Inheritance and home ownership are particularly important factors.
-
Labour markets generate inequality through the skills premium created by technological change, the persistent gender wage gap, and underdeveloped markets in developing countries that create rural-urban disparities.
-
Government intervention can reduce inequality through progressive direct taxation and cash benefits for low-income households. However, indirect taxes can be regressive. The balance between direct and indirect taxation is crucial.
-
The Kuznets curve suggests that inequality may initially increase during economic development before eventually decreasing at higher development levels. However, empirical evidence for this relationship is mixed and varies significantly by region.