International Competitiveness and Productivity (Edexcel A-Level Economics A): Revision Notes
International Competitiveness and Productivity
Introduction to international competitiveness
When analysing the UK's trading position within Europe and with other international partners, understanding the relative competitiveness of UK goods and services is essential. The UK has maintained a deficit on the current account for an extended period, particularly throughout the 2000s. However, this does not automatically mean that UK goods are uncompetitive in international markets. To properly assess competitiveness and understand its significance, we need to examine how it can be measured and identify the factors that influence it.
Understanding competitiveness is crucial because it affects not only a country's trade balance but also employment levels, living standards, and overall economic prosperity. A country that maintains strong competitiveness can better weather economic challenges and capitalize on opportunities in global markets.
Competitiveness of UK goods
Factors affecting demand for exports and imports
The demand for UK exports in global markets depends on several interconnected factors. For any good, demand generally relates to its price, the prices of competing goods, and consumer incomes and preferences. Similarly, when considering UK exports, we must think about:
- The price of UK goods
- The price of goods from other countries
- Incomes in the rest of the world
- International consumers' preferences for UK goods compared to alternatives
For international transactions, the exchange rate plays a crucial additional role, as it determines the purchasing power of UK incomes in the rest of the world. The demand for imports into the UK follows similar principles, depending on the relative price of domestic and imported goods, UK incomes, consumer preferences, and the exchange rate.
All these factors combine to determine the balance between export and import demand, which ultimately affects the current account position.
The role of exchange rates in competitiveness
Exchange rates are fundamental to understanding international competitiveness. They influence the levels of both imports and exports by affecting the relative prices that consumers face. The exchange rate has fluctuated considerably over time, and these movements have important implications for UK competitiveness.
Understanding exchange rate measures
Nominal exchange rate
The nominal exchange rate represents the rate at which one currency exchanges for another, without any adjustment for price differences. When we see exchange rate quotes in newspapers or online, these are nominal rates.
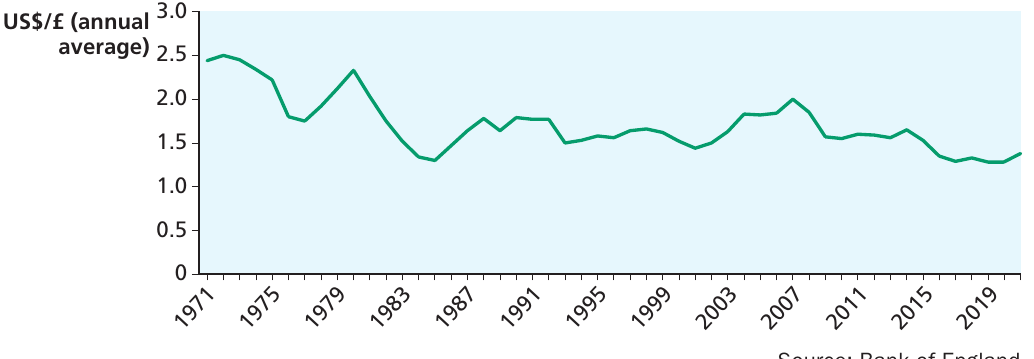
This figure shows the time path of the US dollar to pound sterling (US$/£) exchange rate since 1971. Several important patterns emerge. The exchange rate experienced significant fluctuations between 1971 and the late 1980s, after which it appears to have remained relatively steady, though it settled at a slightly lower level from around 2016 onwards.
The fall from a peak of $2.50 to the pound in 1972 to $1.38 in 2019 might initially suggest an improvement in the competitiveness of UK products. Americans would get more pounds for their dollars in 2019 compared to 1972, potentially making UK goods more attractive to purchase. However, this interpretation requires careful consideration because other factors do not remain constant over such long periods.
Real exchange rate
The nominal exchange rate alone does not provide a complete picture of competitiveness. The real exchange rate is the nominal exchange rate adjusted for differences in relative inflation rates between countries. This measure gives a more accurate assessment of how competitive a country's goods actually are in international markets.
To understand why this matters, consider that the competitiveness of UK goods in the US market depends not only on the exchange rate but also on how prices change over time in both countries. If UK prices rise more rapidly than US prices, this partially offsets any downward movement in the exchange rate. This is why we refer to the nominal exchange rate when discussing the raw exchange rate, and why calculating the real exchange rate is necessary for proper competitiveness analysis.
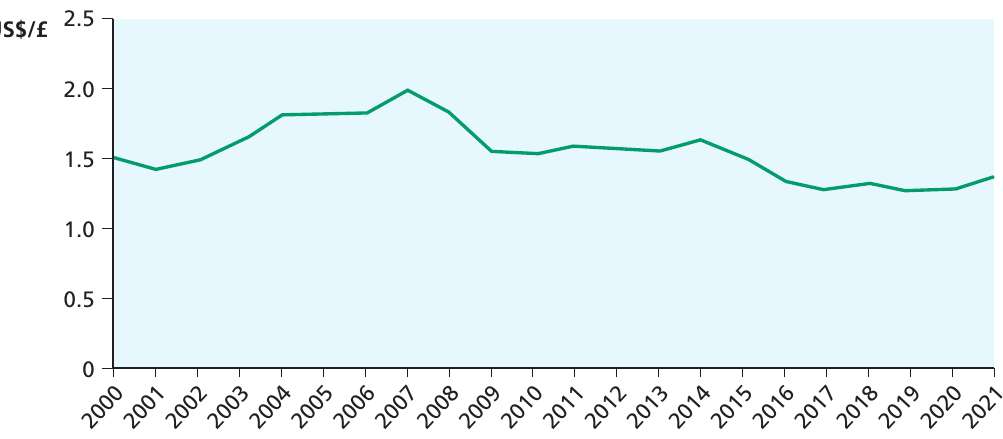
The real exchange rate for the period since 2000 reveals a different pattern from the nominal rate. Overall, there does not appear to be any strong long-term trend in the series. The real rate was at a similar level at both the beginning and end of the period, having fallen slightly from 2016 onwards. This reflects the fact that the USA and UK experienced similar inflation rates during this period, meaning that changes in the nominal rate were the primary driver of real exchange rate movements.
Calculating the real exchange rate
The real exchange rate calculation adjusts the nominal rate for price level differences. The table below demonstrates this calculation for the UK compared to the Eurozone:
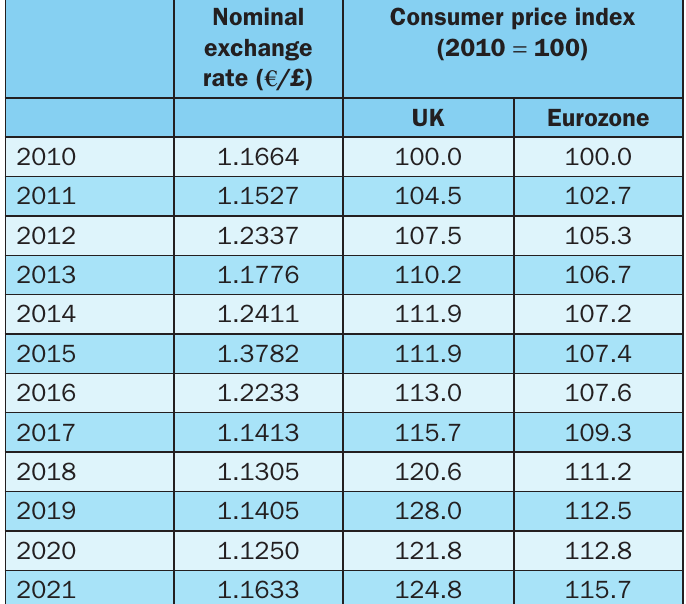
Worked Example: Calculating the Real Exchange Rate
To calculate the real exchange rate for 2017, we multiply the nominal exchange rate by the ratio of prices in the UK to the euro area.
Given information:
- Nominal exchange rate:
- UK price index:
- Eurozone price index:
Calculation:
Interpretation: This shows that the real exchange rate had not fallen by as much as the nominal rate, because prices in the UK had risen by more than in the Eurozone over the period.
Exam tip: Understanding the distinction between real and nominal values is important throughout economics, not just for exchange rates. Always ensure you are clear about the difference between real and nominal measures, and why this distinction matters for economic analysis.
Sterling effective exchange rate
The exchange rate series discussed above relate specifically to competitiveness relative to the USA. An alternative and broader measure is the sterling effective exchange rate, which shows the strength of sterling relative to a weighted average of exchange rates of the UK's trading partners.
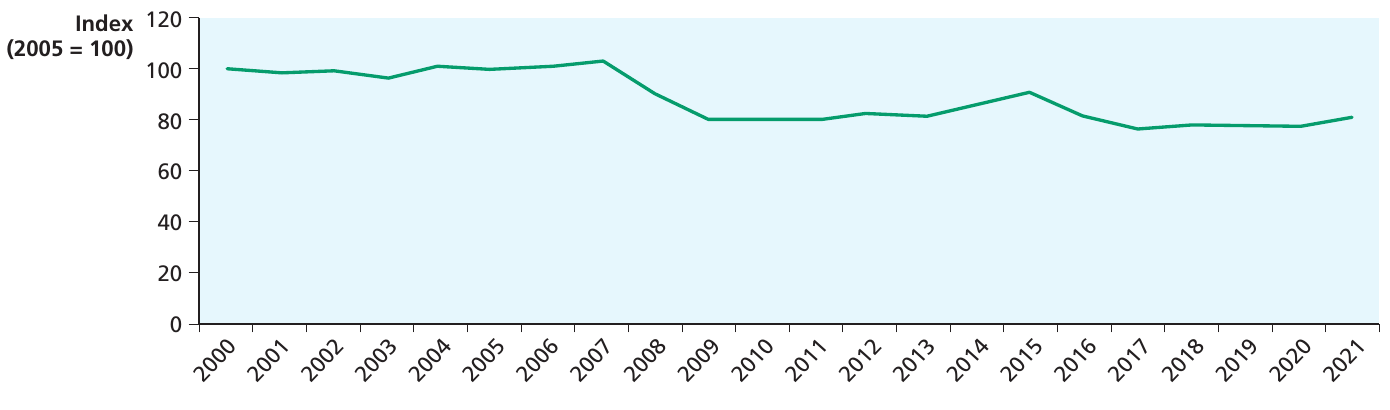
This figure illustrates the strength of sterling against a basket of currencies from the UK's major trading partners. Notice the significant fall in the effective rate that occurred towards the end of 2008 during the financial crisis, followed by a further fall in 2016 after the Brexit vote. These declines suggest that UK goods became more price-competitive in international markets during these periods, though this advantage may be offset if other factors, such as productivity or quality, did not keep pace with competitor nations.
International differences in productivity
From a different perspective, competitiveness also depends on the relative costs of production in different countries, which can significantly influence the prices that firms charge. If UK firms face higher unit labour costs than their trading partners, this places them at a disadvantage in terms of costs, which affects their ability to compete internationally.
Different levels of productivity across countries are central to understanding these cost differences. Productivity is a measure of productive efficiency – specifically, how much output can be generated from a given amount of input.
Key term: labour productivity
Labour productivity is a measure of output per worker, or output per hour worked. It indicates how efficiently labour is being used in the production process.
Measures of productivity
International comparisons of productivity are not straightforward, as measurements are subject to differences in data collection methods and work practices across countries. One common approach is to compare GDP per head of population as a measure of productivity levels. However, this can be misleading because working hours vary significantly between countries. In particular, working hours are longer in the UK than in many other European countries, so differences in GDP per head partly reflect differences in the quantity of labour input rather than true productivity differences. The measure will also be misleading if there are differences in participation rates between countries.
GDP per hour worked
A more reliable indicator of relative productivity levels is GDP per hour worked, as this takes into account the differences in hours worked per person across countries.
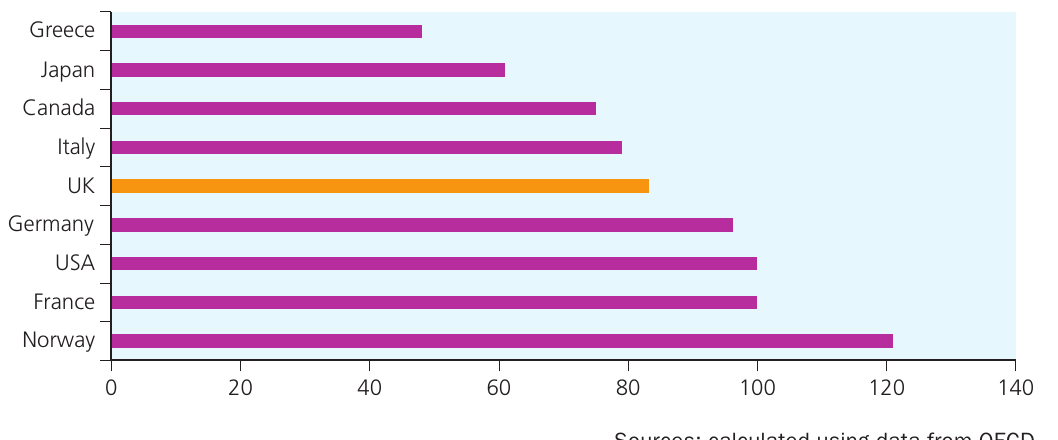
This international comparison shows that whilst the UK outperforms countries such as Greece and Japan on this measure, UK productivity is only approximately 83% of that achieved in the USA and less than 70% of that in Norway. This substantial productivity gap has important implications for UK competitiveness and living standards.
The time path of GDP per hour worked, indexed to , provides further insights into productivity trends over time.
| Year | France | Germany | Greece | Italy | UK | USA |
|---|---|---|---|---|---|---|
| 1990 | 100 | 100 | 100 | 100 | 100 | 100 |
| 2000 | ~108 | ~105 | ~110 | ~108 | ~108 | ~115 |
| 2010 | ~120 | ~115 | ~110 | ~110 | ~115 | ~135 |
| 2019 | ~135 | ~145 | ~110 | ~120 | ~118 | ~160 |
The UK's performance shows relatively modest growth, increasing by about 53% between 1990 and 2019 compared to its 1990 level. Germany saw stronger productivity growth, increasing by 46% over the same period. The figure also highlights the severe problems that Greece faced during the recession that started in the late 2000s. Productivity went into decline at that time and had not recovered by the end of the period shown.
Total factor productivity
Total factor productivity is the average productivity of all factors of production, measured as the total output divided by the total amount of inputs used. This is a more comprehensive measure than labour productivity alone, as countries may differ in their use of capital as well as labour.
Measuring total factor productivity is more difficult than measuring labour productivity because the measurement of the capital stock is especially prone to error and misinterpretation. However, estimates of multifactor productivity growth provide valuable insights.
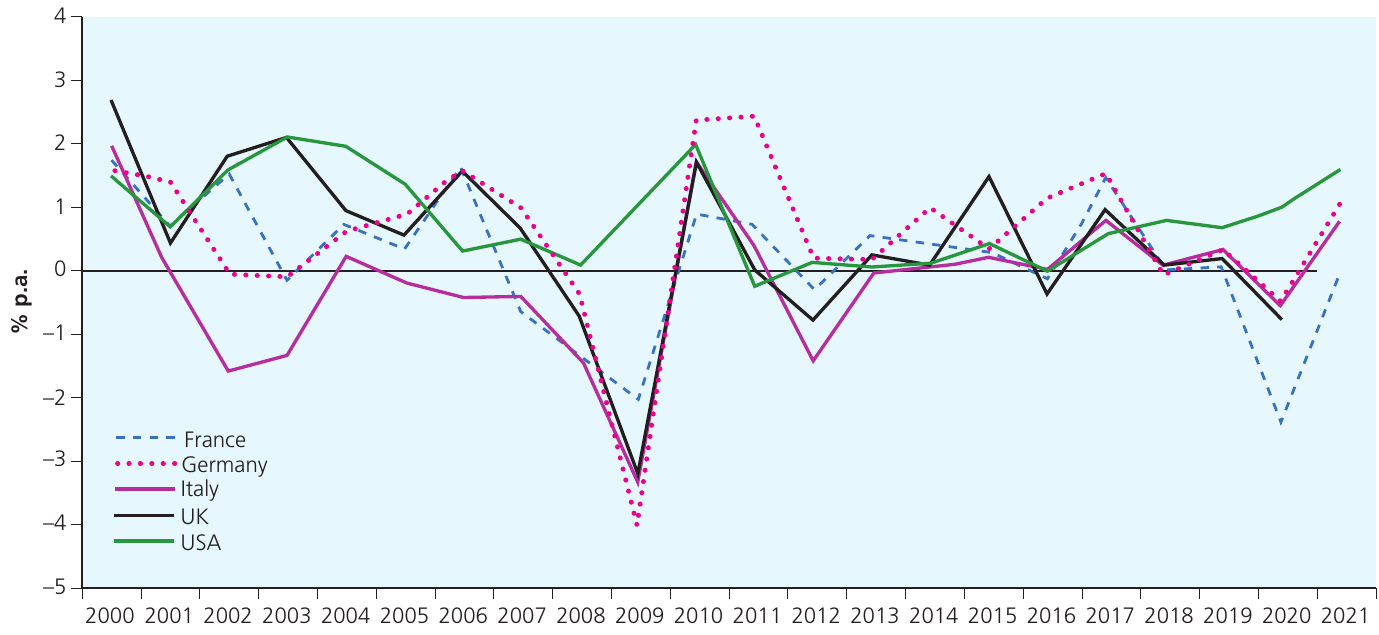
One notable feature of this figure is that all countries except the USA experienced a sudden and severe fall in multifactor productivity at the time of the financial crisis in 2008/09. The impact of the COVID-19 pandemic beginning in 2020 is also visible, showing another sharp decline across all countries shown.
Unit labour costs
Comparing productivity levels and changes across countries is crucial because of their influence on international competitiveness. However, productivity differences alone do not tell the whole story. We must also account for differences in rates of pay, which affect the relative costs of production across countries.
Unit labour costs measure the average cost of labour per unit of output produced. If a country experiences higher increases in unit labour costs over time, this will reduce the competitiveness of the goods produced.
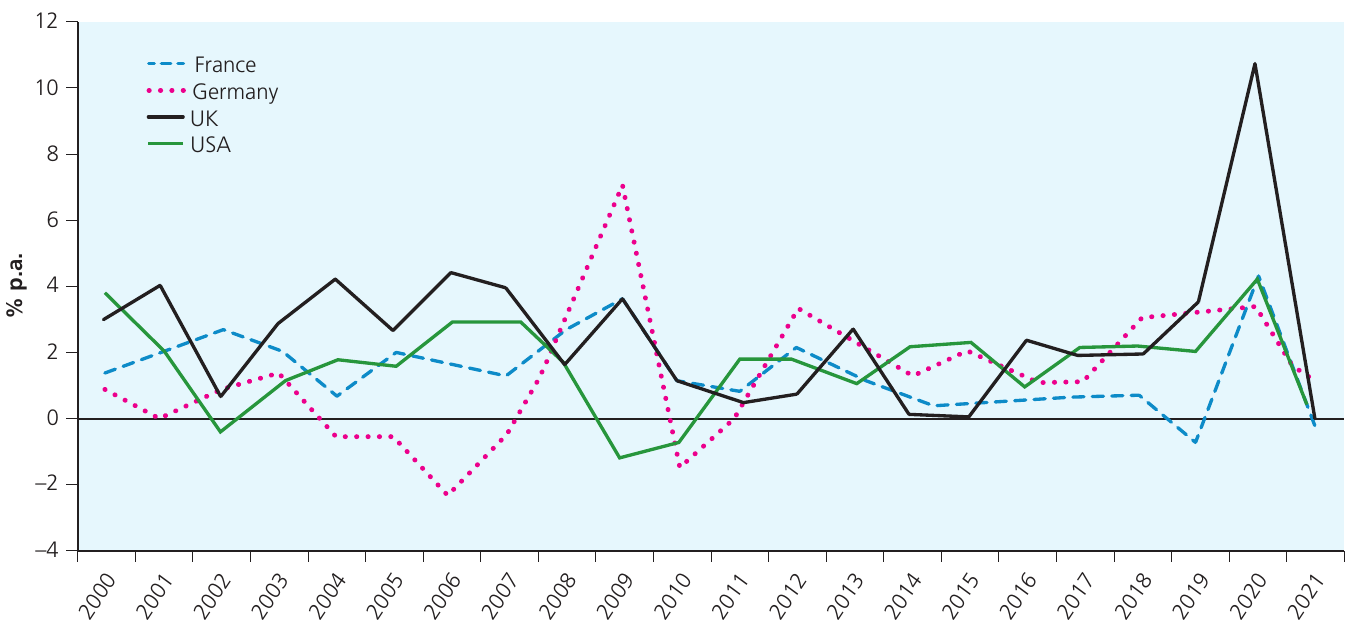
This figure shows how unit labour costs have increased in selected countries since 2000. Germany enjoyed a period in the early 2000s when unit labour costs were falling, giving German firms a competitive advantage. However, notice how European countries saw large increases in unit labour costs at the time of the financial crisis. This is what we would expect if output is falling but firms retain workers in employment rather than reducing their workforce. The sudden rise in UK unit labour costs in 2020 during the pandemic lockdown is also apparent. This reflects the impact of the furlough scheme, when labour costs were supported by government intervention even as output fell.
Productivity and competitiveness
Countries gain from trade by exploiting their comparative advantage, so maintaining that comparative advantage is important. If productivity in the UK grows more slowly than in countries such as the USA and Germany, this implies a loss of competitiveness over time. This may mean that the UK gains less from its exporting activity in world markets. International competitiveness may also be eroded if the UK experiences inflation at a more rapid rate than its trading rivals.
These considerations suggest that there are significant benefits to be gained from maintaining international competitiveness by improving productivity and keeping inflation under control. The consequences of failing to do so can be serious for an economy's trade performance and overall economic wellbeing.
The impact on the balance of payments
If the UK finds that its exports have become less competitive, and that imports have become more competitive with domestic goods, then this could result in a fall in aggregate demand and a possible increase in unemployment, magnified by multiplier effects. This situation could arise if the UK experiences inflation at a higher rate than its trading partners.
Furthermore, if the UK experiences a deficit on the current account of the balance of payments, there will also be a corresponding surplus on the financial account. This means the UK funds the deficit by selling financial assets to economic agents overseas. In the long run, the income paid out on foreign investment feeds through to reinforce the deficit on the primary income component of the current account.
Trade-offs and risks
The benefits of engaging in trade have been widely discussed in economic theory. When world trade is expanding, the gains from trade can help maintain the economy at or close to full employment. However, there is a potential downside. Suppose there is a global recession – what then? If the economy is heavily committed to trade and reliant on export revenues, a sudden fall in export demand could deepen the recession in the domestic economy.
This is the risk of being export-oriented in economic activity. Nevertheless, in normal times, it is generally better to be competitive in international markets than to be uncompetitive.
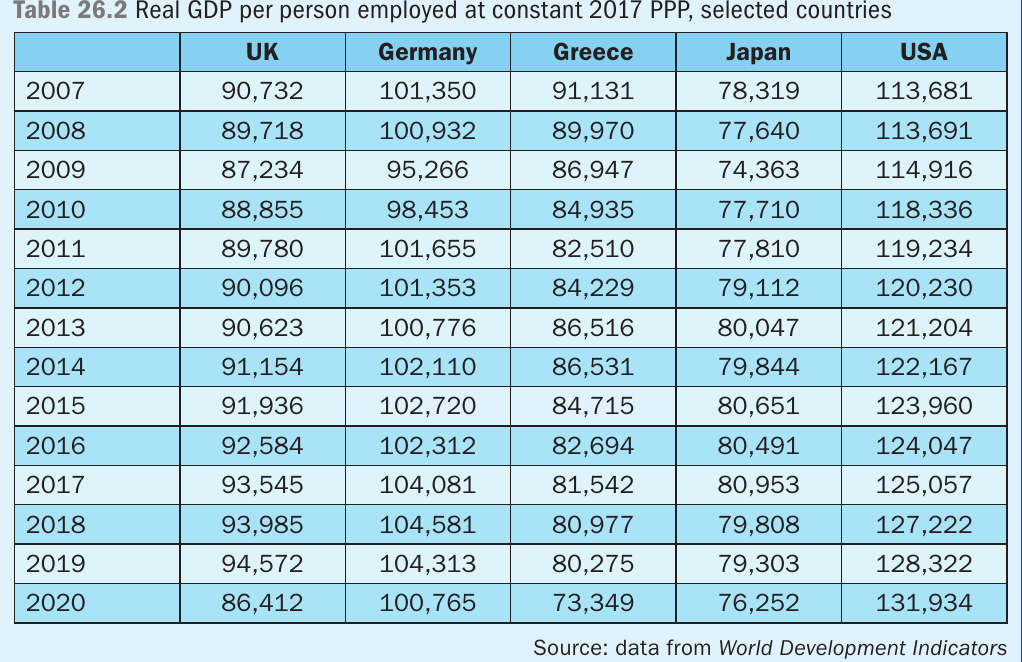
This table shows real GDP per person employed (a measure of labour productivity) for selected countries from 2007 to 2020, measured at constant 2017 purchasing power parity (PPP). The data reveals that the USA consistently shows the highest productivity levels, ranging from approximately $113,000 to $131,000 per worker. Germany ranks second with values between $95,000 and $104,000. The UK's performance falls in the middle range at around $87,000 to $94,000. Greece shows a concerning declining trend throughout the period, whilst all countries experienced a productivity decline in 2020, likely due to the COVID-19 pandemic's economic impact.
Case study: The UK's productivity puzzle
Productivity is crucial for any economy for several reasons. Relative productivity levels across countries influence the international competitiveness of an economy's output. If the products that a country seeks to export are lacking in quality or design, or if they are inefficiently produced, then it will always be difficult to compete abroad. Additionally, it is increases in productivity through time that allow living standards to rise. If productivity stagnates, then workers will not see their earnings increasing over time.
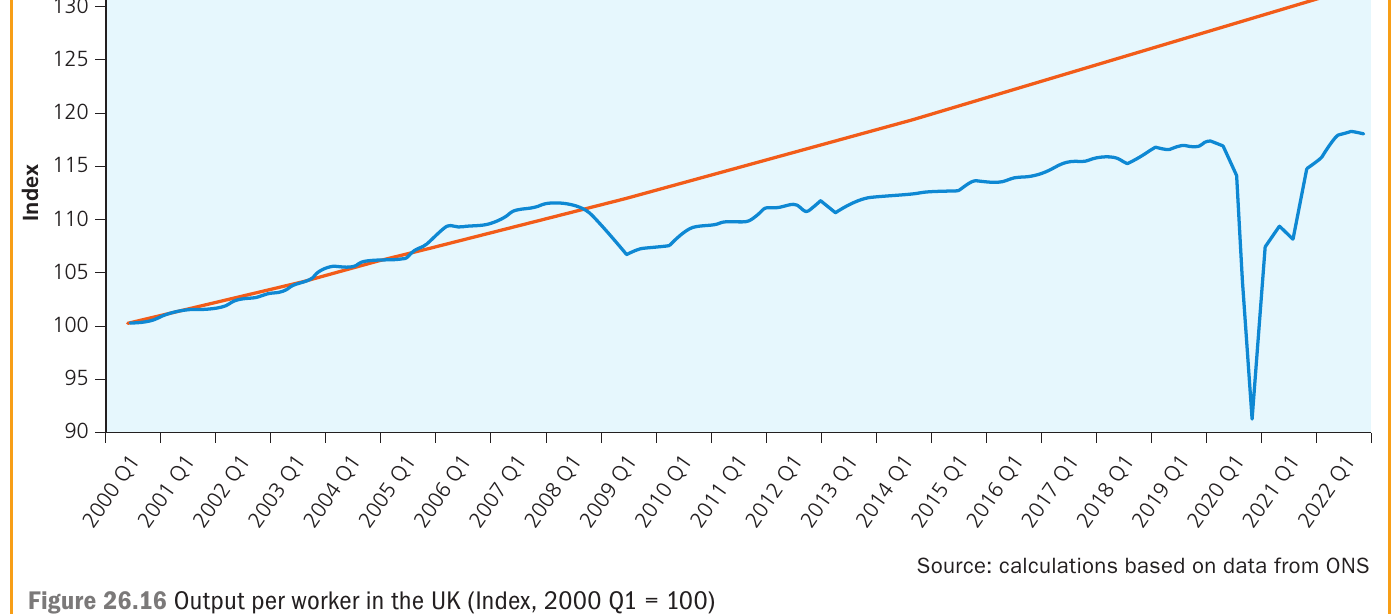
This figure shows the time path of output per worker since the first quarter of 2000, presented as an index with . The blue line represents the 'actual' quarterly output per worker data, whilst the orange line shows a 'trend' line based on calculating the average rate of change between 2000 Q1 and 2008 Q2, then extrapolating this forward to the second quarter of 2022.
The trend line reveals how productivity would have changed had it continued to increase at its previous average rate. This shows the extent to which productivity has fallen short of its trend since 2008. The figure also dramatically illustrates the enormous disruption caused by the COVID-19 pandemic, with output per worker plummeting in 2020 before recovering.
Understanding the UK's poor productivity performance
The UK has attracted considerable criticism for its poor productivity performance over many years. The consensus among economists often suggests that the UK's performance on this key variable has been disappointing, and that the UK ranks near the bottom of the productivity league table among developed nations.
The way in which productivity was affected by the recession (and continued to stagnate afterwards) was shared by many of the UK's trading partners. However, this provides little consolation if the UK is already towards the bottom of the league table. The UK has lagged behind key trading partners such as France, Germany and the USA in terms of productivity growth.
Factors behind the productivity gap
The impact of globalisation should theoretically be positive for productivity, as the increasing interconnectedness of economies facilitates technology transfer. Furthermore, the mobility of labour within the EU should have allowed the spread of good working practices and human capital, which could have brought productivity levels closer across countries.
The UK has performed well in some areas, particularly in terms of new start-up companies and investment in research and development. However, evidence suggests that one of the key factors the UK has not addressed effectively is the dissemination of new techniques and best practices throughout the economy. In other words, the UK has succeeded in having some world-class companies at the cutting edge of technology and efficiency, but there has been a long tail of companies that have been slow to catch up.
Policy implications
Encouraging the dissemination of best practice techniques and investing in human capital appear to be essential if the UK is to close the productivity gap with its international competitors. The need to improve the UK's performance in terms of productivity has become even more pressing given the disruptions of Brexit and the COVID-19 pandemic, both of which have created additional challenges for UK businesses and workers.
Remember!
Key Points to Remember:
-
International competitiveness depends on relative prices and productivity. A country's ability to compete internationally is determined not just by the exchange rate, but by the real cost and quality of its goods and services compared to competitors.
-
The real exchange rate is more meaningful than the nominal rate for assessing competitiveness. By adjusting for inflation differences between countries, the real exchange rate provides a more accurate picture of whether goods have become more or less competitive over time.
-
Labour productivity is measured as output per hour worked. This is a better indicator than GDP per capita because it accounts for differences in working hours across countries.
-
Unit labour costs combine productivity and wages. Even if a country has lower productivity, it can still be competitive if wage costs are correspondingly lower. Unit labour costs measure the average cost of labour per unit of output.
-
The UK faces a significant productivity challenge. UK productivity has consistently lagged behind major competitors like the USA and Germany, with productivity growth slowing particularly since the 2008 financial crisis. Addressing this productivity gap through innovation, skills development, and spreading best practices is essential for maintaining UK competitiveness.