The hydrological cycle influences water budgets and river systems at a local scale (Edexcel A-Level Geography): Revision Notes
The hydrological cycle influences water budgets and river systems at a local scale
Water Budgets
Balance between precipitation, evaporation and run-off can be useful at global, regional and local scales
Available Soil Water
Amount of water that can be stored in the soil and is available for growing crops
- At certain times of the year there may be a shortage of water but at other times a surplus
- At a local scale water budgets show the annual balance between inputs (precipitation) and outputs (EVT) Water balance equation:
- P ⇒ Precipitation, Q ⇒ Discharge
- E ⇒ Evapotranspiration, S ⇒ Changes in storage River regimes
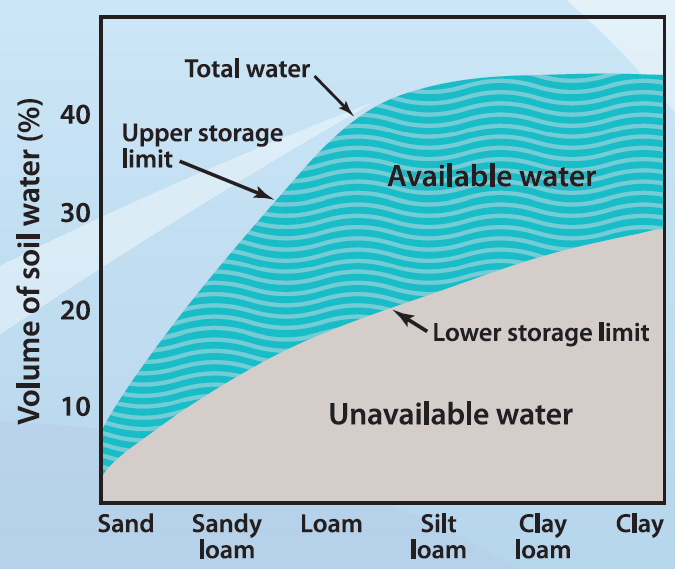
Water Availability
River regime
Annual variation in discharge or flow of a river at a particular point ir gauging station, usually measured in cumecs
River system
To the entire drainage basin, including all the tributaries connected to it
The Character of a Regime of the Resulting Stream or River is Influenced by Several Variable Factors:
- The size of the river and where discharge measurements are taken along its course
- The amount, seasonality and intensity of the precipitation
- The temperatures, with possible meltwater and high rates of evaporation in the summer
- The geology and soils particularly their permeability and porosity; groundwater noted in permeable rocks is gradually released into the river as base flow
- The type of vegetation cover: wetlands can hold water and release it slowly into the river
- Human activities aimed at regulating a river's discharge (dam building)
River Levels in Northern Areas Often Higher Due to Snow Melt
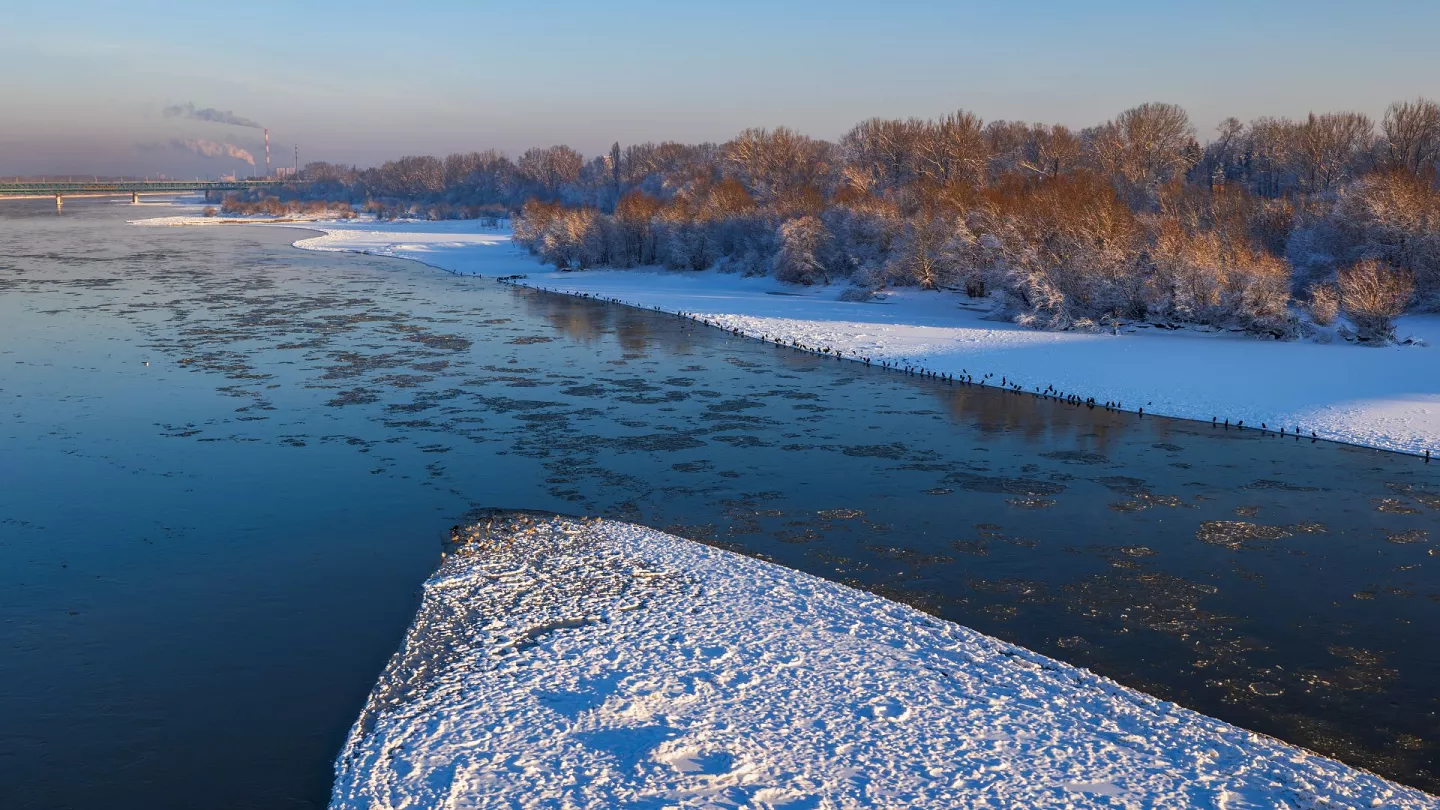
Winters warmer than -8C are making snow disappear - and threatening Europe's water supplies
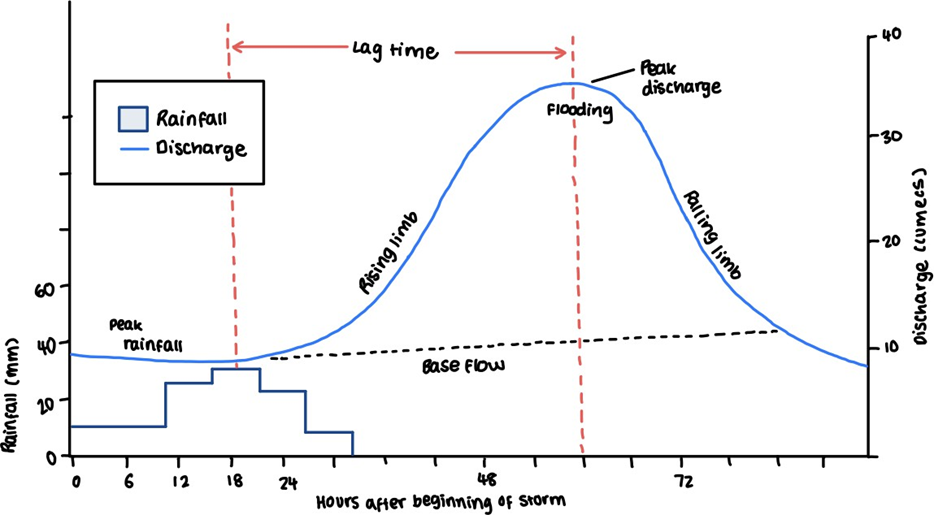
Storm Hydrographs
↳ Shows the variation of discharge within a short period of time (usually a singular storm)
- Rate of flow against time past a specific point in river
- Before storm starts, main supply of water to river/stream = groundwater/base flow
- As storm develops, water goes to stream via various methods (infiltration, throughflow, overland flow)
Main Features
- Once rainfall input begins, discharge starts to rise - shown on rising limb
Rising Limb
Part of a storm hydrograph in which the discharge starts to rise
- Peak discharge eventually reached as water takes time to move through system to the gauging station of the basin
Peak Discharge
Time when river reaches its highest flow
- Time interval between peak rainfall and peak discharge = lag time
- Once storm input has ceased the amount of water in the river starts to ↓ (shown by recessional limb)
Recessional Limb
Part of the storm hydrograph in which the discharge starts to ↓
- Eventually the discharge returns to base flow
Base Flow
The normal day-to-day discharge of the river
- Peak rainfall → Part of a storm hydrograph where the water in the river decreases
Different storm hydrographs
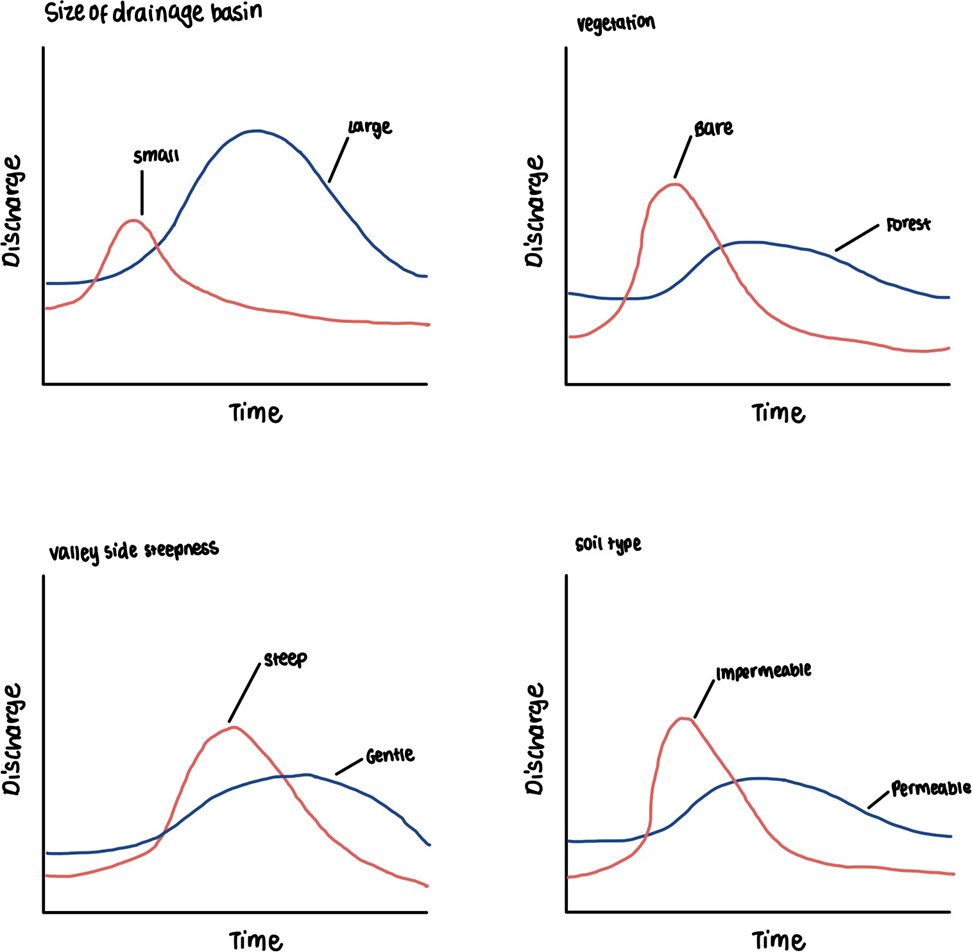
- Shape of a storm hydrograph of the same river may vary from one rain event to the next
- Variation closely linked to the nature of the rainfall event
- Shape of hydrograph also varies from one river to another
- Flashy hydrographs ⇒ Hydrographs with very steep limbs, especially rising limbs, a high peak discharge and a short lag time
Impact of Urbanisation on Hydrological Processes
Most sig factor that leads to ↑ flood risk
-
Building activity leads to clearing of vegetation - exposes soil and ↑ overland Piles of disturbed and dumped soil ↑ erodibility. Eventually bare soil is replaced by a concrete and tarmac (both impermeable)
-
High density of buildings means that rain falls onto roofs and is then swiftly dispatched into drains by gutters
-
Drains and sewers built → ↓ distance storm water must travel before reaching a channel
-
Urban rivers → Tend to be channelised with embankments to guard against flooding
-
Bridges can restrain the free discharge of floodwaters and act as local dams for upstream floods
- In extreme weather events urban areas are highly vulnerable
Factors that Affect the Type of Storm Hydrograph
| Factor | Flashy river | Flat river |
|---|---|---|
| Characteristics of hydrograph | ● Short lag time ● High peak ● Steep rising limb | ● Long lag time ● Low peak ● Gently sloping rising limb |
| Climate | ● Intense storm which exceeds the infiltration capacity of the soil ● Rapid snow melt as temperatures suddenly rise above zero ● Low evaporation rates due to low temperatures | ● Steady rainfall which is below infiltration capacity of soil ● Slow snow melt as temperatures gradually rise above zero ● High evaporation rates due to high temperatures |
| Rock type | Impermeable rocks Eg. Granite | Permeable rocks Eg. Limestone |
| Soils | Low infiltration (eg. clay based soil) | High infiltration rates (eg. sandy soil) |
| Relief | High, steep slopes which promote surface runoff | Low, gentle slopes that allow infiltration and percolation |
| Basin size | Small | Large |
| Drainage density | High drainage density • more streams and rivers per unit area | Low drainage density • less streams and rivers per unit area |
| Vegetation | Bare • low levels of interception | Dense • higher levels of interception |
| Antecedent conditions | Basin already wet from a previous rain, high water table | Basin dry, low water table, unsaturated soil so high infiltration |
| Human activity | ● Urbanisation producing impermeable concrete and tarmac surfaces ● Deforestation reduces interception ● Arable land | ● Low population density with few impermeable surfaces ● Reforestation increases interception ● Pastoral and forested land |