Inequalities (Edexcel A-Level Mathematics): Revision Notes
📚 Revision Notes
2.4.3 Inequalities on Graphs
Inequalities on Graphs
When dealing with inequalities on graphs, the goal is to determine the region of the graph that satisfies a given inequality. Inequalities can be linear or quadratic, and they represent areas above, below, or between curves on the coordinate plane.
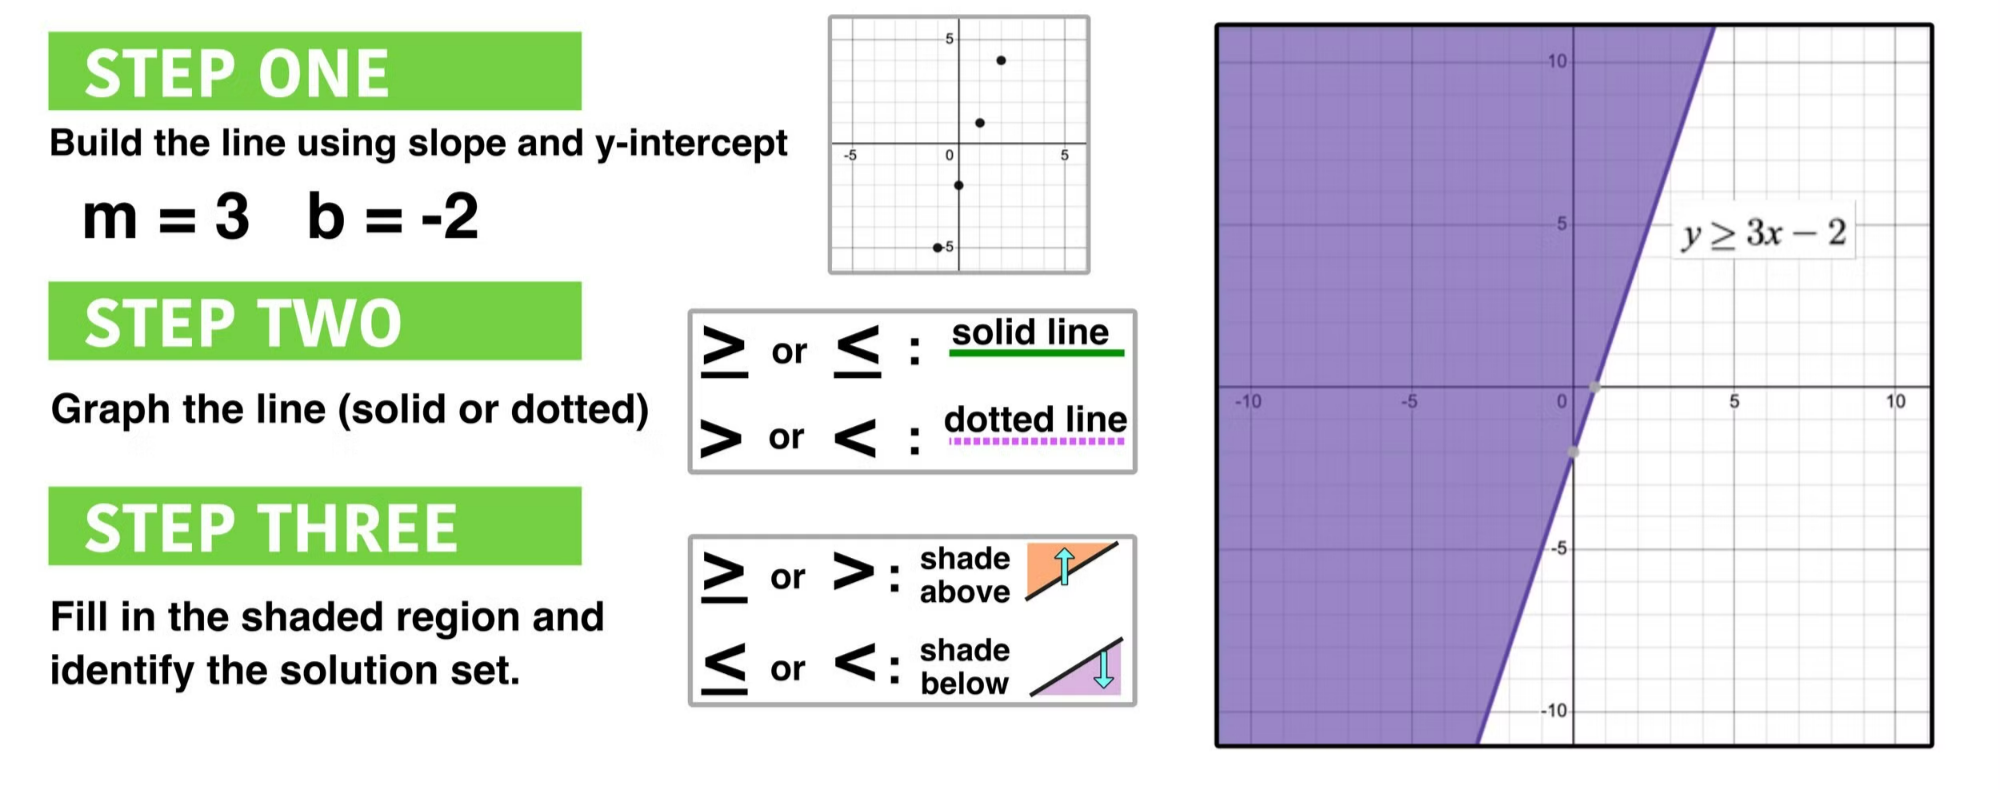
1. Linear Inequalities:
infoNote
A linear inequality involves a linear equation, such as:
Steps to Graph:
- Graph the Boundary Line:
- Start by graphing the equation as a straight line.
- If the inequality is strict , use a dashed line to indicate that points on the line are not included.
- If the inequality is non-strict or , use a solid line to show that points on the line are included.
- Determine the Shaded Region:
- Choose a test point (often the origin, to determine which side of the line to shade.
- Substitute the test point into the inequality. If the inequality holds true, shade the region that includes the test point; otherwise, shade the opposite side.
infoNote
Example: For :
- Draw the line with a dashed line.
- Test is false, so shade the region above the line.
2. Quadratic Inequalities:
infoNote
Quadratic inequalities involve a quadratic equation, such as:
Steps to Graph:
- Graph the Parabola:
- Start by graphing the equation
- Use a solid line for , and a dashed line for
- Determine the Shaded Region:
- Similar to linear inequalities, choose a test point to determine which side of the parabola satisfies the inequality.
- For quadratic inequalities like the region below the parabola is typically shaded.
infoNote
Example: For:
- Graph the parabola using a solid line.
- Test is false, so shade the region below the parabola.
3. Systems of Inequalities:
When working with multiple inequalities, the solution is the region where the shaded areas overlap.
infoNote
Example: Solve the system:
Steps:
- Graph with a dashed line and shade above.
- Graph with a solid line and shade below.
- The solution is the region where the shaded areas overlap.
Summary:
- Linear Inequalities: Represent straight lines with shading indicating where the inequality holds true.
- Quadratic Inequalities: Involve parabolas with shading above or below the curve.
- Systems of Inequalities: Solve by finding the region where all inequalities intersect. The visual approach using graphs is crucial for understanding the solutions to inequalities, as it clearly shows the region that satisfies the given conditions.