Mode and median (AQA GCSE Statistics): Revision Notes
Mode and median
When working with frequency tables for discrete data, you'll need to calculate two important types of averages: the mode and the median. These measures help us understand the central tendency of our data set.
What is the mode?
The mode represents the most frequently occurring value in a data set. When working with frequency tables, you need to identify which data value appears most often by looking at the frequency column.
The mode is always the actual data value, never the frequency number itself.
Finding the mode from a frequency table
To find the mode, follow these steps:
- Look at the frequency column in your table
- Identify the highest frequency value
- Find which data value corresponds to this highest frequency
- That data value is your mode
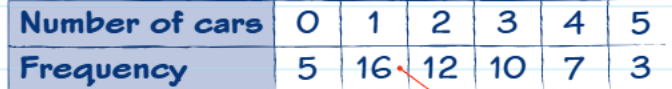
Worked Example: Finding the Mode
In this example, the highest frequency is 16, which corresponds to 1 car. Therefore, the mode is 1 car.
What is the median?
The median is the middle value when all data values are arranged in ascending order. Since frequency tables already show data in order, we use a cumulative frequency method to find the median efficiently.
Finding the median from a frequency table
The process involves several clear steps:
Step 1: Create a cumulative frequency column
- Start with the first frequency value
- Add each subsequent frequency to the running total
- Continue until you reach the final total
Step 2: Calculate the median position Use the formula: Median position = Where n = total frequency (the final cumulative frequency)
Step 3: Locate the median value
- Find which data value corresponds to the median position
- Use the cumulative frequency column to identify this
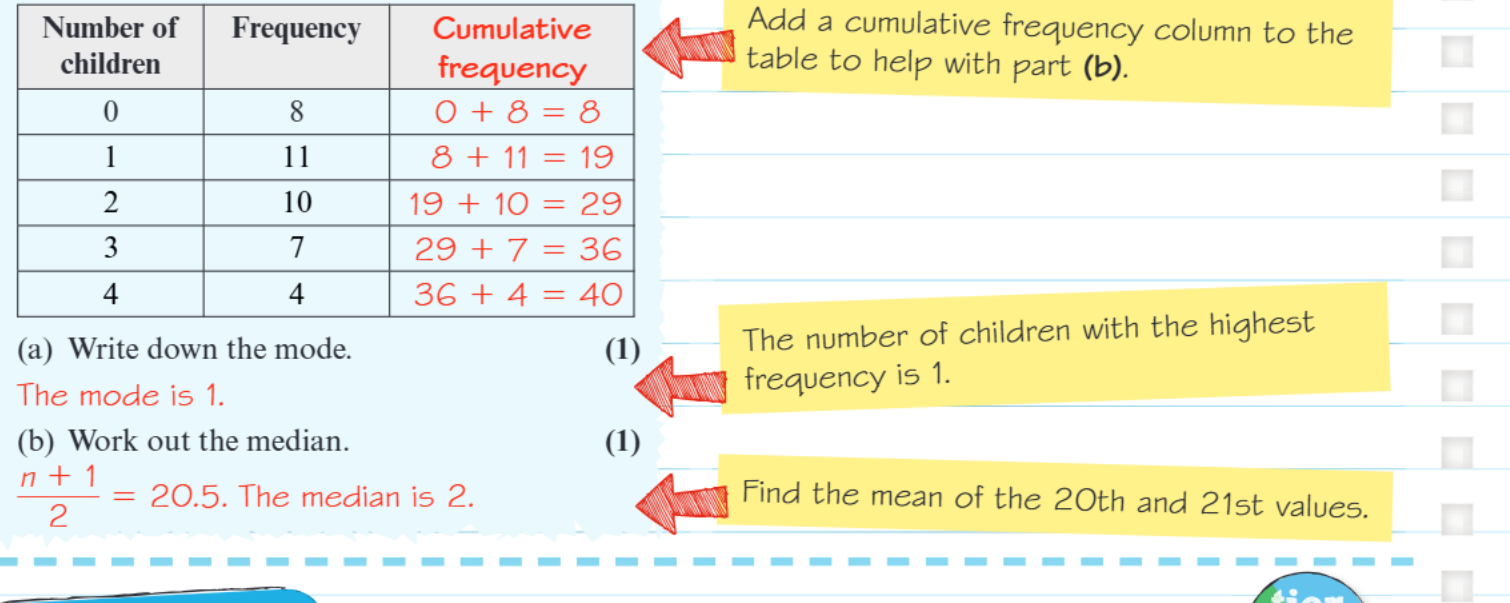
Worked Example: Finding the Median
Let's work through this example step by step:
- The cumulative frequencies are: 8, 19, 29, 36, 40
- Total frequency (n) = 40
- Median position =
- The 20.5th value falls in the cumulative frequency range where we reach 29 (which includes positions 20-29)
- This corresponds to 2 children, so the median is 2
Worked example with both mode and median
Consider this attendance data:
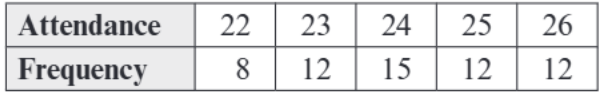
Worked Example: Finding Both Mode and Median
Finding the mode:
- Highest frequency is 15
- This corresponds to attendance of 24
- Therefore, mode = 24
Finding the median:
- First, calculate cumulative frequencies: 8, 20, 35, 47, 59
- Total frequency (n) = 59
- Median position =
- The 30th value falls in the range where cumulative frequency reaches 35
- This corresponds to attendance of 24
- Therefore, median = 24
Common exam tips and traps
Exam trap 1: Don't confuse the mode with the frequency
- The mode is 1 car (the data value)
- NOT 16 (the frequency value)
Exam trap 2: Remember the median formula
- Always use , not just
- This gives you the position, not the actual median value
Exam tip: When the median position is a decimal (like 20.5), you're looking for a value that falls between two data points, but since we're dealing with discrete data in frequency tables, the median will be the data value in whose cumulative frequency range this position falls.
Key Points to Remember:
- The mode is the data value with the highest frequency - never confuse it with the frequency number itself
- To find the median, always create a cumulative frequency column first
- Use the formula to find the median position, where n is the total frequency
- The median is the actual data value that corresponds to the calculated position in your cumulative frequency
- Both mode and median are measures of central tendency that help describe your data set's typical values