Estimating the median (AQA GCSE Statistics): Revision Notes
Estimating the median
When working with grouped data displayed in a histogram, we cannot find the exact median value because individual data points are grouped into class intervals. However, we can calculate a good estimate of the median using a systematic four-step process.
Understanding the method
The median represents the middle value when data is arranged in order. For grouped data, we need to identify which class interval contains the median position and then estimate where exactly within that interval the median lies.
The key insight is that we use the concept of frequency density and areas of bars to work out proportions within the median class interval. This approach allows us to make accurate estimates even when we don't have access to individual data points.
Four-step method for estimating the median
Step 1: Find the total frequency (n)
Add up all the frequencies from your frequency table or calculate from the histogram by multiplying each frequency density by its class width.
Step 2: Find the position of the median
Calculate n ÷ 2 to find the position of the median. This tells you that the median is the value that has exactly half the data below it.
Step 3: Identify the median class interval
Work out which class interval contains the median position by adding up frequencies from the lowest class until you reach or exceed the median position.
Step 4: Calculate the estimate using linear interpolation
Use the frequency density formula to work out how far into the median class the median lies, then add this to the lower class boundary.
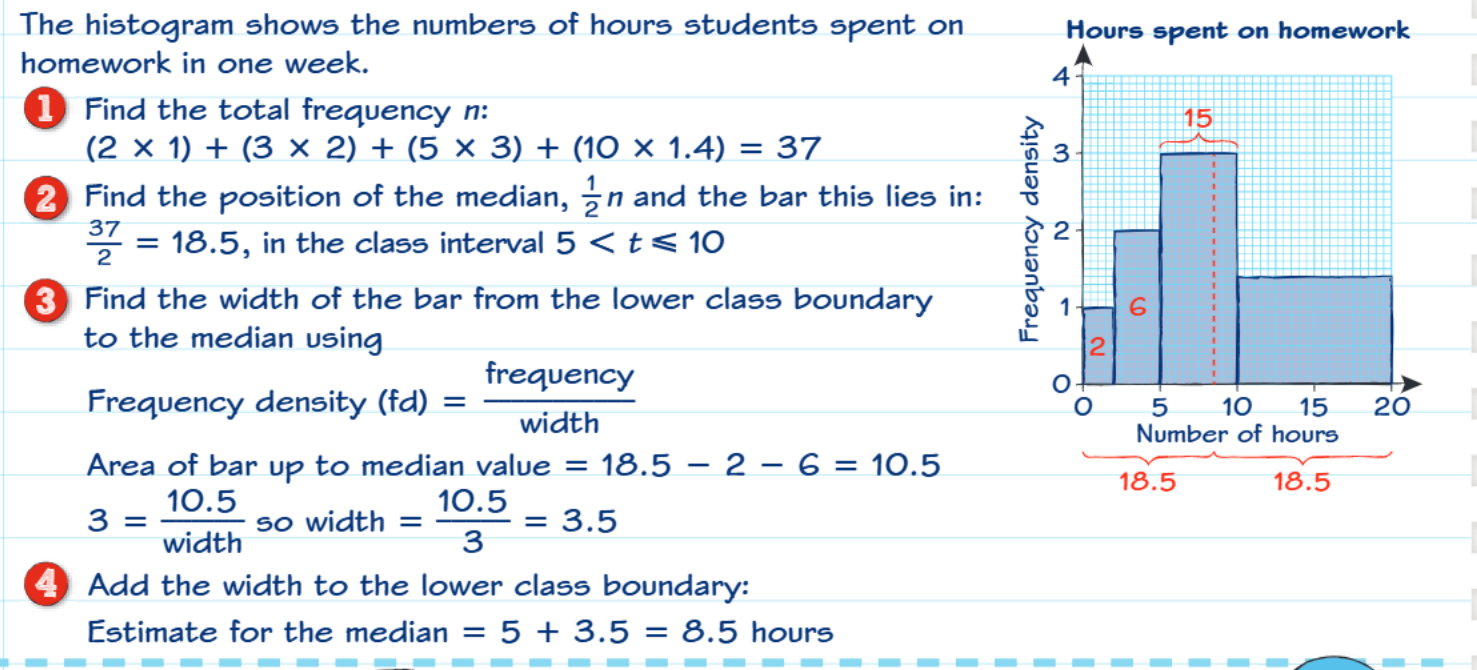
Worked Example: Hours spent on homework
Let's work through a complete example using data about hours students spent on homework.
Step 1: Calculate total frequency From the histogram, we can calculate: students
Step 2: Find median position So we need to find the 18.5th value when data is arranged in order.
Step 3: Locate the median class
- First class (0 to 5): 2 students (total so far: 2)
- Second class (5 to 10): 6 students (total so far: 8)
- Third class (10 to 15): 15 students (total so far: 23)
Since we need the 18.5th value and we have 8 students by the end of the second class, the median must lie in the third class interval .
Wait, let me recalculate this from the image more carefully:
- The median position 18.5 falls in the class interval
- We need to find how far into this interval the median lies
Step 4: Calculate the estimate Area of bar up to median value The frequency density is 3, so: Therefore:
Estimate for median = lower class boundary + width = 5 + 3.5 = 8.5 hours
Key formula: Frequency density
This formula is essential because histograms show frequency density on the y-axis, not frequency. The area of each bar represents the actual frequency for that class interval.
Worked Example: Age of employees
Here's another example using employee age data:
Step 1: Total frequency employees
Step 2: Median position (the 95th employee when arranged by age)
Step 3: The median lies in class interval
Step 4: Calculate the estimate:
- Area up to median value
- Frequency density = 4, class width = 10
- So: , therefore class width needed
Estimate for median = 35 + 7.5 = 42.5 years
Common exam tips
Remember the difference between frequency and frequency density. Histograms always show frequency density on the y-axis, so you need to multiply by class width to get the actual frequency.
Check your median position calculation. For n data values, the median position is , not as used for raw data.
Be careful with class boundaries. Make sure you're using the correct lower class boundary when adding your calculated width.
Show your working clearly. Examiners want to see each step of the calculation, especially how you determine which class contains the median.
Key Points to Remember:
- Use the four-step method: find total frequency, calculate median position, identify median class, then estimate using linear interpolation
- Frequency density = frequency ÷ width - this is crucial for working with histograms
- The median position for grouped data is n ÷ 2, where n is the total frequency
- Always add your calculated width to the lower class boundary to get your final estimate
- Check that your answer makes sense by ensuring it lies within the identified median class interval