Comparing data sets (AQA GCSE Statistics): Revision Notes
Comparing data sets
When you need to compare two or more groups of data, you can't just look at the raw numbers and make a judgement. Instead, you need to use statistical measures to make fair and meaningful comparisons. This process involves calculating key statistics and then interpreting what they tell you about the differences between the groups.
Statistical comparison is essential because raw data alone can be misleading. Two data sets might look similar at first glance but have very different characteristics when you examine their central tendencies and spread.
Basic comparison using lists
The most straightforward way to compare data sets is to calculate the median and range for each group. This approach works well with smaller data sets and provides clear, easy-to-interpret results.
Worked Example: Comparing Test Scores
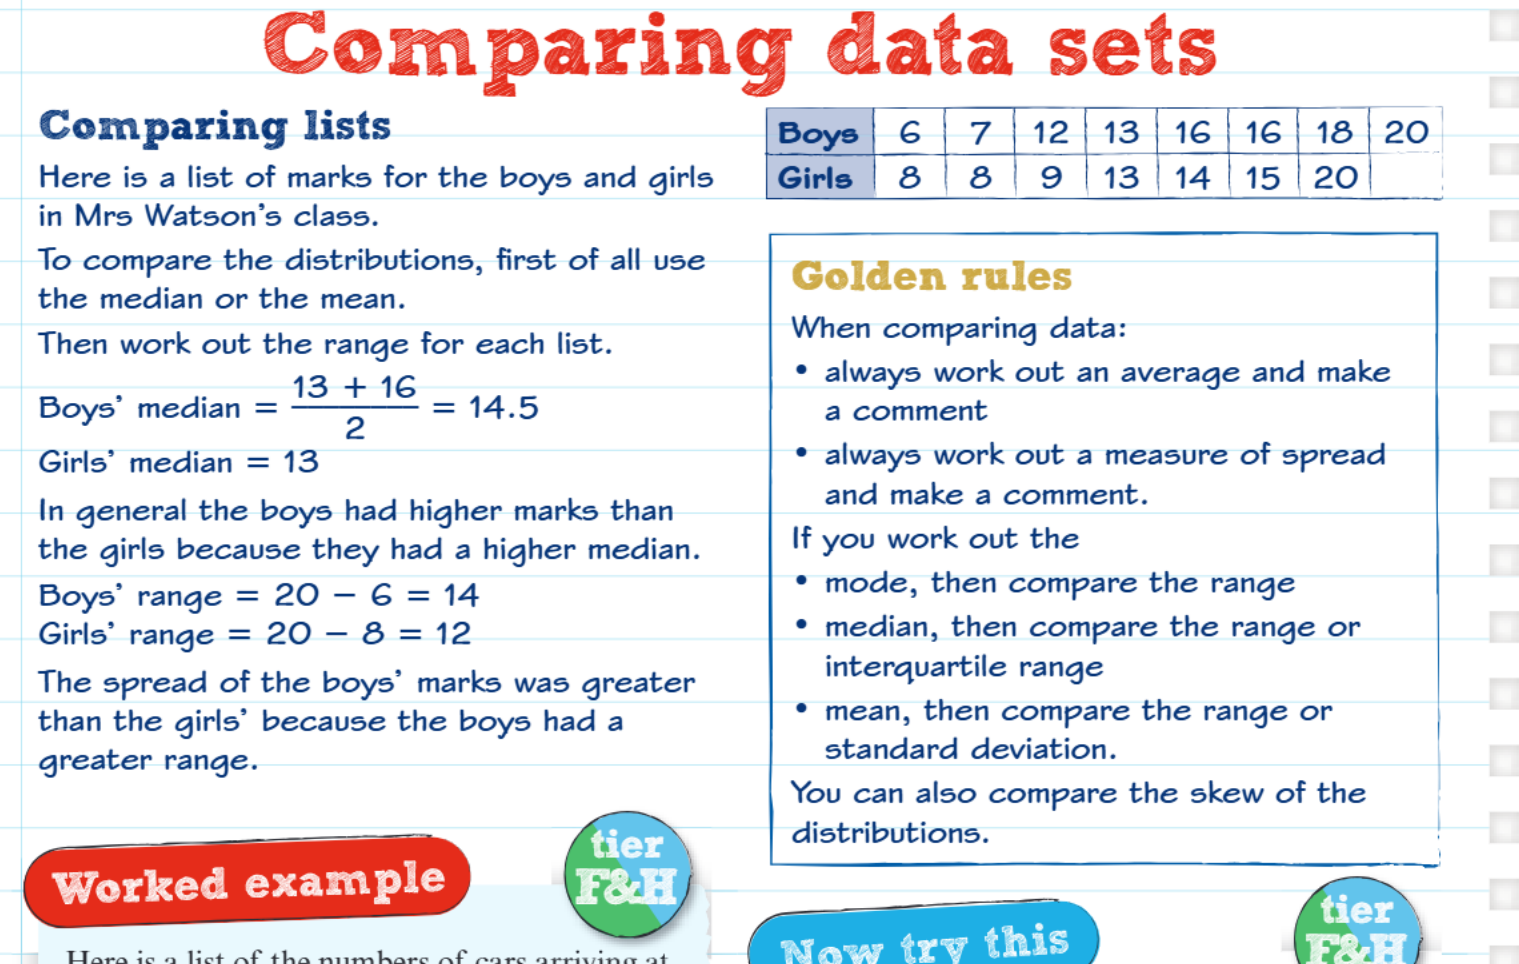
Let's compare boys' and girls' test marks using the step-by-step method.
Step 1: Calculate the median for each group
The median is the middle value when data is arranged in order. If you have an even number of values, take the mean of the two middle values.
For the boys' data: 6, 7, 12, 13, 16, 16, 18, 20
- There are 8 values, so the median is the average of the 4th and 5th values
- Median =
For the girls' data: 8, 8, 9, 13, 14, 15, 20
- There are 7 values, so the median is the 4th value
- Median = 13
Step 2: Calculate the range for each group
The range shows how spread out the data is: Range = highest value - lowest value
- Boys' range =
- Girls' range =
Step 3: Compare and conclude
From these calculations, you can conclude that the boys generally performed better (higher median) but their marks were more varied (larger range). The girls' performance was more consistent, with less variation between scores.
Golden rules for comparing data
Essential Steps for Data Comparison
When comparing any data sets, you should always follow these fundamental principles:
Always calculate an average Choose the most appropriate measure of central tendency (usually the median or mean) and calculate it for each group. This gives you a typical value to represent each data set.
Always calculate a measure of spread Work out how scattered the data is using the range, interquartile range, or standard deviation. This tells you about the consistency within each group.
Choose the right measures for your data
- If you're using the mode, compare it with the range
- If you're using the median, compare it with the range or interquartile range
- If you're using the mean, compare it with the range or standard deviation
Consider the shape of distributions You can also examine the skew of the distributions to understand whether the data is evenly spread or if there are outliers affecting the results.
Advanced comparison using box plots
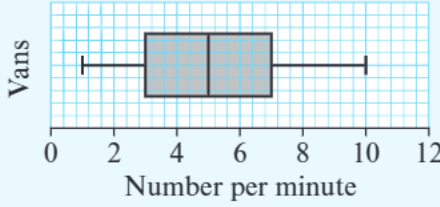
Box plots provide a visual way to compare data sets and can show you information about quartiles, medians, and the overall distribution shape. They're particularly useful when you need to compare multiple groups quickly.
Reading Box Plot Information
From a box plot, you can identify:
- The median (middle line of the box)
- The lower quartile (left edge of the box)
- The upper quartile (right edge of the box)
- The range (distance from left whisker to right whisker)
- The interquartile range (width of the box)
Worked example with frequency data
Let's analyse car arrival data: 2, 2, 3, 5, 5, 6, 6, 6, 7, 7, 7, 8, 9, 9, 11
Worked Example: Finding Quartiles
Finding the median:
- There are 15 values, so the median is the 8th value
- Median = 6
Finding the lower quartile:
- Position = th value
- Lower quartile = 5
When comparing this to the van data shown in the box plot, you can see that cars arrived more frequently on average, and the distribution of car arrivals was more concentrated around the median.
Comparison using statistical measures
For more sophisticated analysis, especially with larger data sets, you can compare means and standard deviations. This method provides more precise statistical information about your data groups.
Understanding Means and Standard Deviations
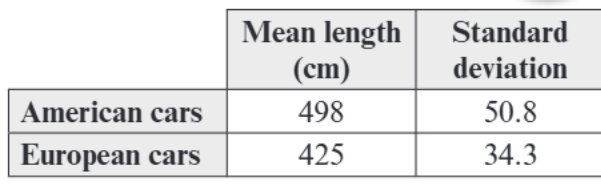
When comparing American cars (mean length 498 cm, standard deviation 50.8) with European cars (mean length 425 cm, standard deviation 34.3):
- American cars are longer on average (higher mean)
- American car lengths vary more (higher standard deviation)
- European cars are more similar in length to each other (lower standard deviation)
This type of comparison is particularly useful when you have large amounts of data or when you want to make more precise statistical statements.
Step-by-step comparison process
Complete Comparison Method
- Organise your data - arrange both data sets in order
- Calculate measures of central tendency - find the median or mean for each group
- Calculate measures of spread - work out the range, interquartile range, or standard deviation
- Compare the averages - which group has the higher typical value?
- Compare the spread - which group shows more variation?
- Write conclusions - explain what these differences mean in the context of the problem
Common exam tips
Exam Success Strategies
- Always show your working clearly when calculating medians and ranges
- Make sure you state what your calculations tell you about the data - don't just leave numbers without explanation
- When comparing, use comparative language like "higher", "more consistent", "greater variation"
- If using box plots, remember to comment on both the central tendency and the spread
- Check your median calculations carefully, especially with even numbers of data values
Key Points to Remember:
- Always calculate both an average and a measure of spread when comparing data sets
- The median and range are often the most appropriate measures for small data sets
- Box plots give you a quick visual comparison of distributions
- Higher spread values indicate more variation in the data
- Your conclusion should explain what the statistical measures mean in the real-world context of the problem