Deciding which average to use (AQA GCSE Statistics): Revision Notes
Deciding which average to use
Understanding when to use different types of averages (mean, median, and mode) is crucial for accurately representing data. Each average has specific strengths and weaknesses that make it more suitable for different types of datasets and situations.
Understanding the three averages
The choice between mode, median, and mean depends on the nature of your data and what you want to communicate about it. Each measure of central tendency tells a different story about your dataset, and selecting the wrong one can lead to misleading conclusions.
Comparing advantages and disadvantages
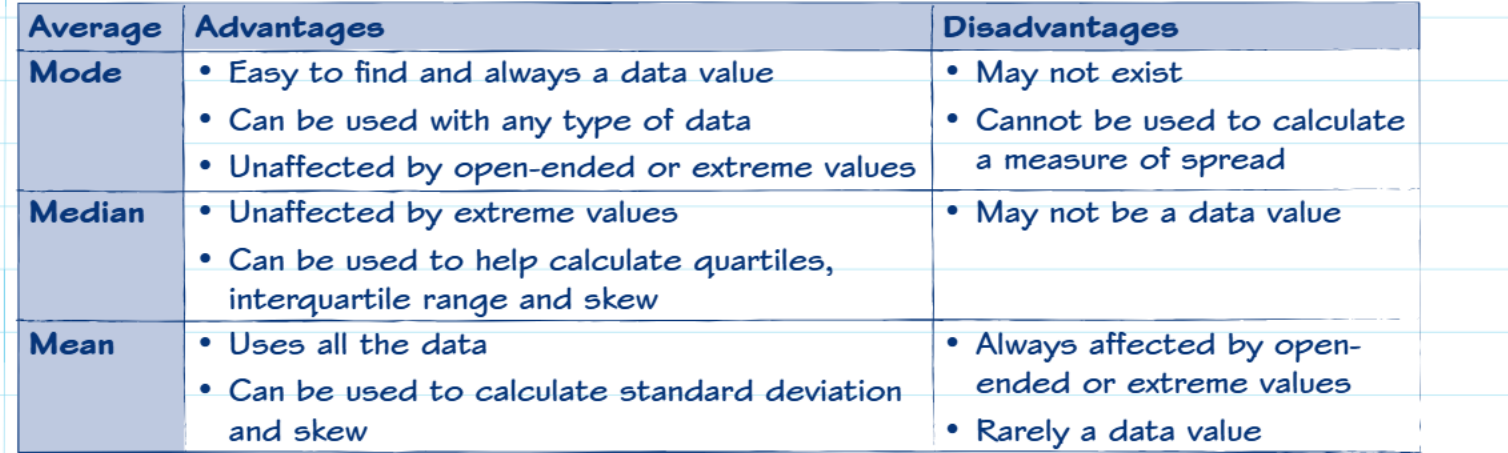
The key to choosing the right average lies in understanding what each one can and cannot do effectively.
Each type of average has unique characteristics that make it more suitable for specific data types and analytical purposes. The table below helps visualise these key differences.
Let's explore each average in detail to understand when they work best.
When to use the mode
The mode represents the most frequently occurring value in your dataset. This average is particularly valuable when working with categorical data or when you need to identify the most common response.
Best used when:
- Working with categorical data (like favourite colours or types of transport)
- You need to identify the most popular or common item
- Your data contains extreme values that would distort other averages
- You want an average that definitely appears in your original data
Avoid using when:
- No value appears more than once (the mode doesn't exist)
- You need to perform further statistical calculations
- Multiple values appear with the same highest frequency
When to use the median
The median is the middle value when data is arranged in order. It's your go-to average when dealing with skewed data or datasets containing outliers.
Best used when:
- Your data contains extreme values or outliers
- Working with income data or house prices (often highly skewed)
- You need to calculate quartiles or interquartile range
- The distribution is not symmetrical
Consider alternatives when:
- The median might not correspond to an actual data value
- You need the average for further statistical calculations like standard deviation
- Working with very small datasets where every value is important
When to use the mean
The mean considers every single value in your dataset, making it the most mathematically useful average for further calculations.
Best used when:
- Your data is roughly symmetrical with no extreme outliers
- You need the average for calculating standard deviation or other statistical measures
- Working with normally distributed data
- You want to use all available information in your dataset
Avoid using when:
- Your dataset contains significant outliers or extreme values
- The data is highly skewed
- You're working with categorical data
Worked examples
Example 1: Using median with stem and leaf diagrams
Consider hospital data showing patient numbers in A&E over 15 nights. When we have a stem and leaf diagram, we can easily find the median position using the formula:
Worked Example: Finding the Median Position
Step 1: Use the median position formula
Step 2: Calculate for 15 values
Step 3: Calculate for additional data (17 values)
This demonstrates how the median remains stable even when new data is added to the dataset.
Example 2: Using mean for target calculations
When Jack has completed 10 tests with a mean score of 17.5 out of 20, we can calculate what he needs on his next test to achieve a target mean of 18:
Worked Example: Target Mean Calculation
Step 1: Calculate current total marks
Step 2: Calculate required total marks
Step 3: Find marks needed on next test
Conclusion: Since the maximum possible score is 20, it's impossible for Jack to achieve his target mean of 18.
Practical applications
Frequency data analysis
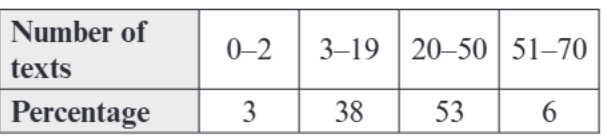
When analysing survey data about text messaging habits, the choice of average depends on what you want to communicate:
Different averages tell different stories:
- Mode: Most common texting behaviour (20-50 texts, 53% of people)
- Median: Would fall in the 20-50 texts category, representing typical behaviour
- Mean: Would be affected by the small percentage sending 51-70 texts daily
For this type of grouped data, the mode often provides the most meaningful insight into typical behaviour patterns.
Making the right choice
Consider these factors when selecting your average:
Nature of the data: Categorical data requires the mode, while numerical data offers all three options.
Distribution shape: Symmetrical data works well with the mean, while skewed data benefits from the median.
Presence of outliers: Extreme values make the median more reliable than the mean.
Purpose of analysis: If you need the average for further calculations, the mean is essential. For identifying typical values, consider the median or mode.
Data representation: The mode guarantees a value that actually exists in your dataset, while mean and median might not.
Key Points to Remember:
- Mode is perfect for categorical data and when you need the most common value, but it might not exist in all datasets
- Median is your best choice when dealing with outliers or skewed data, as it's not affected by extreme values
- Mean uses all data points and is essential for further statistical calculations, but can be heavily influenced by outliers
- Always consider the shape of your data distribution before choosing an average
- The mean is the only average that can be used to calculate measures of spread like standard deviation