Frequency table or grouped data (AQA GCSE Statistics): Revision Notes
Frequency table or grouped data
Understanding standard deviation for frequency tables
When working with data presented in a frequency table, we need special formulas to calculate the standard deviation. Unlike simple datasets where each value appears once, frequency tables show us how many times each value occurs, so we must account for these frequencies in our calculations.
What makes frequency tables different?
In a frequency table, values can appear multiple times, so we need to weight each value by its frequency when calculating statistics. This is why we need modified formulas that account for how often each value occurs.
There are two equivalent formulas you can use to find the standard deviation from a frequency table:
Formula 1:
Formula 2:
Both formulas will give you exactly the same answer. The choice of which one to use often depends on the information you're given and personal preference.
Key components you need to understand
Before diving into calculations, make sure you understand these essential elements:
- represents the total frequency (the sum of all frequencies) - this equals
- (x-bar) represents the mean, calculated as
- represents the frequency of each value
- represents each data value
Critical Exam Information
These formulas are not provided on your exam formula sheet, so you need to memorise them thoroughly. Make sure you know both versions and can apply them confidently under exam conditions.
Worked example 1: Football goals
Let's work through a complete example step-by-step. A football team's goal-scoring record over 25 games is shown below:
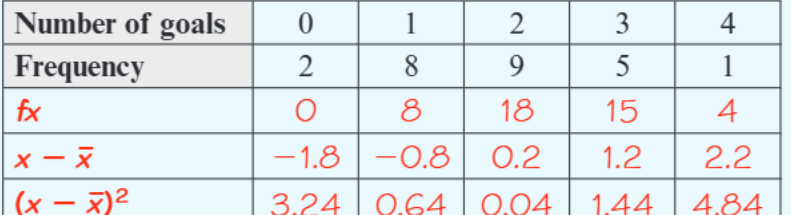
Worked Example: Calculating Standard Deviation from Frequency Table
Step 1: Calculate the mean ()
First, we need to find (sum of frequency × value):
The total frequency
Therefore: goals
Step 2: Calculate deviations from the mean
For each value, subtract the mean:
Step 3: Square the deviations and multiply by frequency
- for 0 goals:
- for 1 goal:
- for 2 goals:
- for 3 goals:
- for 4 goals:
Step 4: Find the sum and calculate standard deviation
(to 3 significant figures)
Worked example 2: Using the alternative formula
Sometimes it's more efficient to use the second formula. Let's look at another example:
In one week, 115 students were late for school. The data shows:
- (sum of frequency × number of times late)
- (sum of frequency × (number of times late)²)
Worked Example: Using Formula 2
Step 1: Calculate the mean
Step 2: Apply the second formula
Which formula should you choose?
Both formulas are equally valid, but here's when each might be more convenient:
Formula Selection Guide
- Use Formula 1 when you need to show all working clearly and have time to calculate each deviation
- Use Formula 2 when you're given directly or when you want a quicker calculation method
The key is to choose the formula that works best with the information you're given and the time you have available.
Common exam pitfalls to avoid
Critical Mistakes to Avoid
-
Forgetting to multiply by frequency - always remember that each calculation must account for how often each value occurs
-
Mixing up and - be very careful with the notation and make sure you're squaring the right values at the right time
-
Rounding too early - keep full accuracy until your final answer, then round appropriately
-
Forgetting the square root - the standard deviation formula includes a square root at the very end
Key Points to Remember:
- There are two equivalent formulas for calculating standard deviation from frequency tables
- Always calculate the mean first using
- Both formulas will give the same final answer when calculated correctly
- These formulas are not on your exam formula sheet - you must memorise them
- Show all working clearly in exam questions for full marks