Quadratic Graphs (Edexcel GCSE Maths): Revision Notes
Quadratic graphs
Understanding quadratic functions
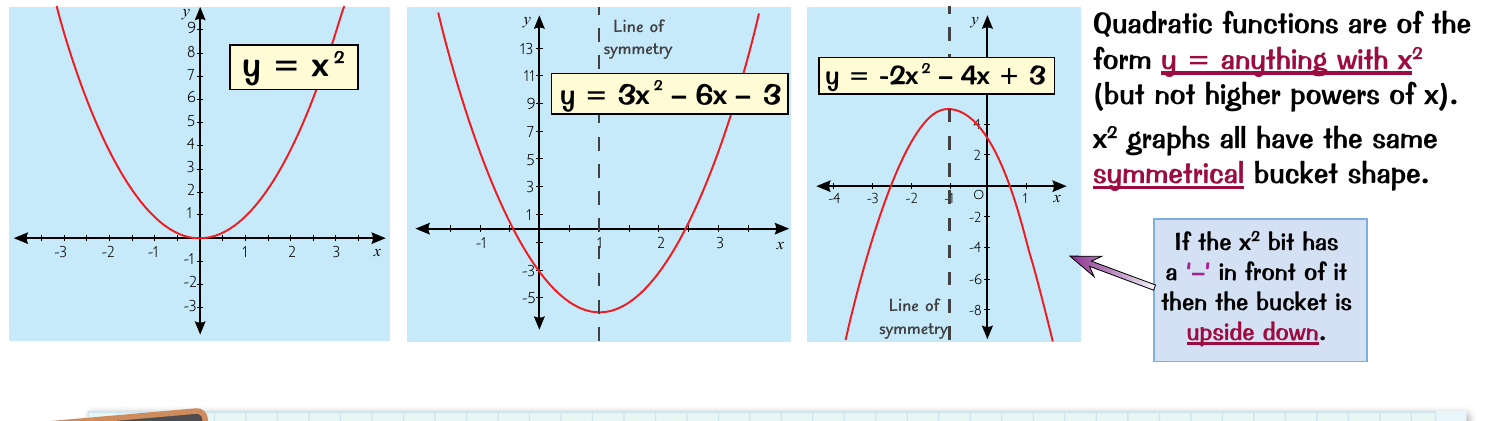
A quadratic function is any mathematical expression that contains an term but no higher powers of . These functions follow the general pattern where the highest power of is squared. Examples include simple forms like or more complex versions such as .
The most distinctive feature of quadratic functions is that they all create the same fundamental shape when graphed. This shape is called a parabola, and it resembles a symmetrical "bucket" or U-shaped curve. Every quadratic graph possesses a vertical line of symmetry that runs through the centre of the curve, creating two mirror-image halves.
The symmetry of quadratic graphs is a crucial property that helps when plotting and analysing these functions. This line of symmetry passes through the vertex (the turning point) of the parabola and divides the curve into two identical sections.
The effect of the coefficient of x²
The coefficient that appears in front of the term determines the orientation of the parabola. When this coefficient is positive, the parabola opens upwards, creating the familiar bucket shape. However, when the coefficient is negative, the parabola flips upside down, opening downwards like an inverted bucket.
Key Rule: If the term has a negative coefficient, the parabola opens downwards (upside-down bucket shape). If positive, it opens upwards.
This means that equations like and will open upwards, whilst an equation like will open downwards due to the negative coefficient in front of .
Plotting quadratic graphs
Creating an accurate quadratic graph requires a systematic approach using a table of values. The process involves selecting appropriate x-values, calculating corresponding y-values, and joining the plotted points with a smooth curve.
Begin by selecting a suitable range of x-values. For most quadratic functions, choosing values from about -5 to 3 provides a good view of the curve's shape. Next, substitute each x-value into the equation to calculate the corresponding y-value.
Worked Example: Plotting
Step 1: Create a table of values
- When :
- When :
- When :
- When :
- When :
- When :
- When :
- When :
Step 2: Plot the coordinate pairs on a grid Step 3: Join with a smooth curve (never use straight lines!)
After calculating all the coordinate pairs, plot these points carefully on a coordinate grid. The final and most important step is joining these points with a completely smooth curve.
Critical Rule: Never use a ruler to connect the points with straight lines, as quadratic graphs are curved throughout. Each point should flow smoothly into the next, maintaining the characteristic parabolic shape.
Solving quadratic equations using graphs
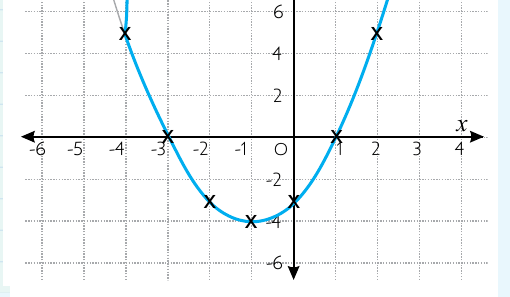
Quadratic graphs provide an effective visual method for solving quadratic equations. When you need to find the solutions to an equation like , you can use the graph of to identify the answers.
The key principle is that you're looking for the x-values where . Graphically, this means finding the points where the parabola crosses the x-axis. These intersection points are called the roots or solutions of the equation.
To solve a quadratic equation graphically:
- Graph the quadratic function
- Find where the parabola crosses the x-axis
- Read the x-coordinates of these crossing points
- These x-values are your solutions
For the equation , examining the graph reveals that the parabola crosses the x-axis at and . These are the two solutions to the equation.
Most quadratic equations yield exactly two solutions, which is logical since a parabola typically intersects the x-axis at two distinct points. However, some special cases exist: a parabola might just touch the x-axis at one point (giving one solution) or might not cross the x-axis at all (resulting in no real solutions).
Key Points to Remember:
- Quadratic functions contain an term and always create U-shaped curves called parabolas
- All quadratic graphs have perfect symmetry with a vertical line of symmetry through their centre
- A negative coefficient in front of causes the parabola to open downwards (upside-down bucket)
- Always connect plotted points with a smooth curve - never use straight lines between points
- To solve quadratic equations graphically, locate where the parabola crosses the x-axis
- Most quadratic equations have exactly two solutions