Histograms and Frequency Density (Edexcel GCSE Maths): Revision Notes
Histograms and frequency density
What are histograms?
A histogram is a special type of bar chart where the bars can have different widths. This makes them different from regular bar charts where all bars have the same width. The varying widths might seem confusing at first, but they're actually very useful for showing grouped data with unequal class intervals.
The key difference: Regular bar charts have equal-width bars, while histograms can have bars of different widths. This flexibility allows histograms to represent data with varying class intervals more accurately.
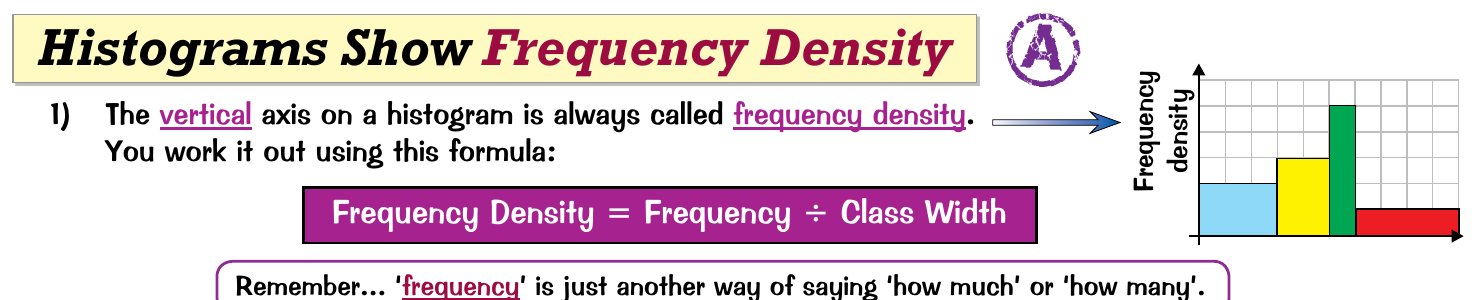
The key thing to remember is that histograms don't show frequency directly on the vertical axis like regular bar charts do. Instead, they show something called frequency density.
Understanding frequency density
Frequency density is what we measure on the vertical axis of a histogram. It's not the same as frequency (which tells us "how many" items are in each group). Instead, frequency density takes into account both the frequency and the width of each class interval.
Think of it this way: if you have a narrow class interval with lots of data points, the frequency density will be high. If you have a wide class interval with the same number of data points, the frequency density will be lower.
The Essential Formula:
This formula helps us calculate the height of each bar in the histogram. Remember that frequency simply means "how much" or "how many" items fall into each group.
Working with the frequency density formula
You can rearrange the frequency density formula to find different values depending on what information you have:
This rearranged formula is particularly useful when you're reading information from a histogram and need to calculate the actual frequency for each class interval.
Step-by-step approach to histogram problems
When working with histograms, follow these systematic steps:
- Add a frequency density column to your data table - Use the formula to calculate the frequency density for each class interval.
- Use the frequency densities to create or label your histogram - The frequency density values become the heights of the bars on your histogram.
- Find missing information - If you have a histogram and need to find missing frequencies, use the rearranged formula: .
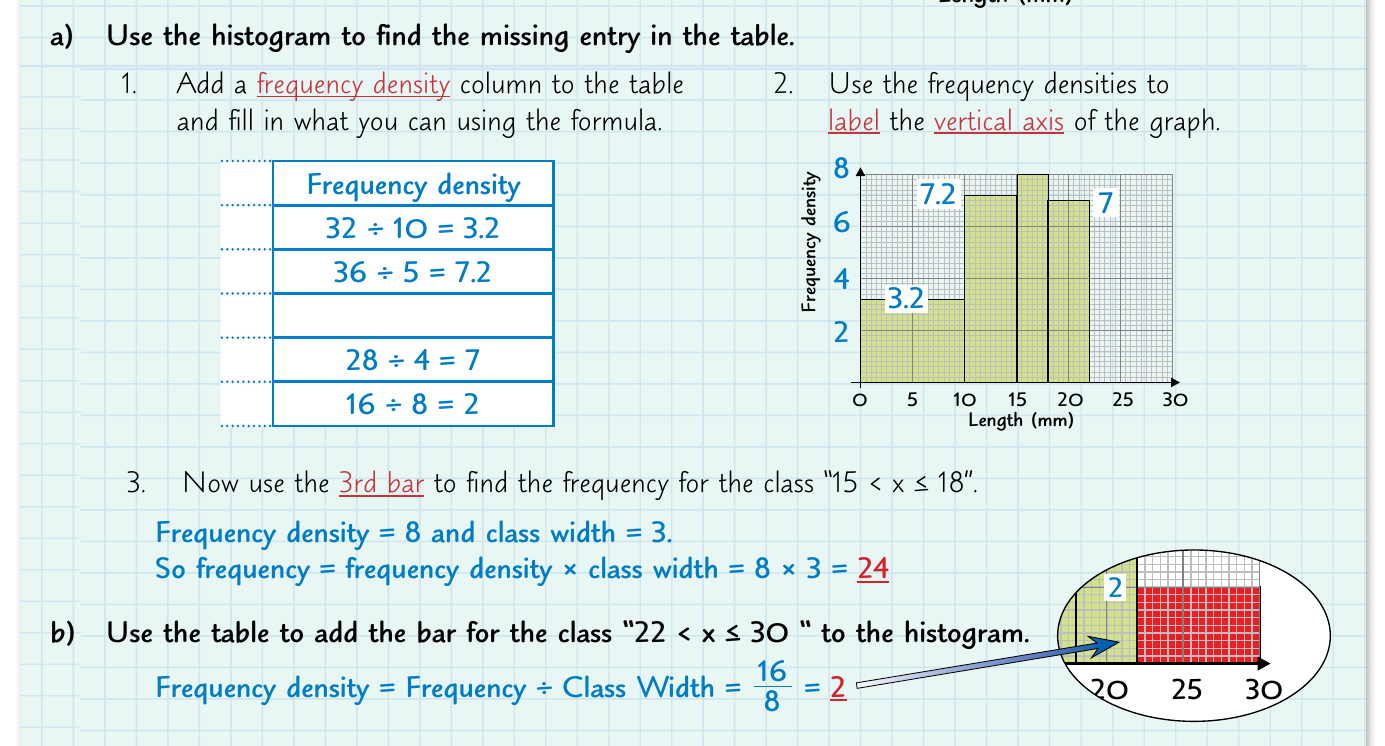
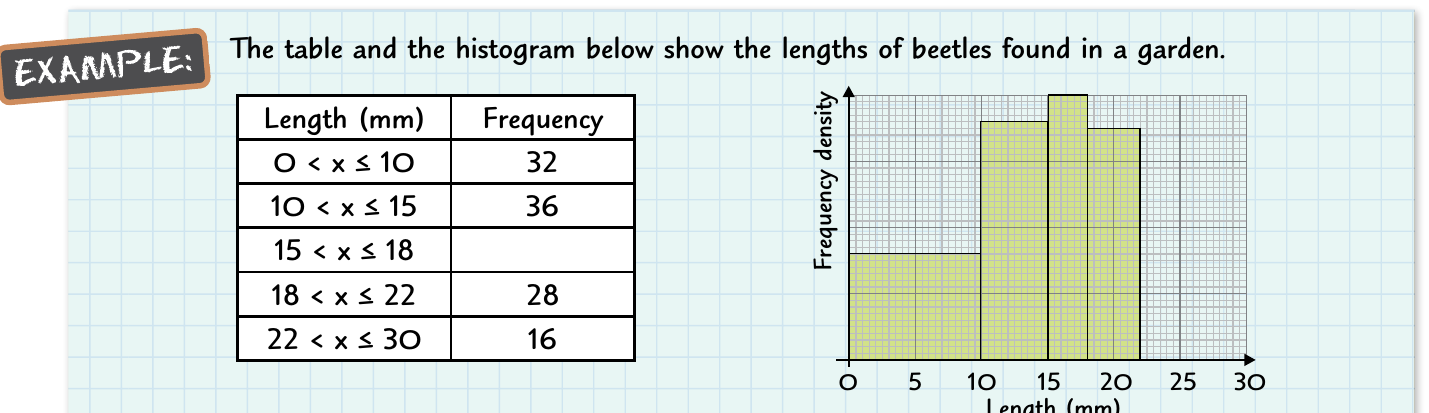
Worked Example: Finding Frequency from a Histogram
If a bar has a frequency density of 8 and the class width is 3, then:
- Frequency = Frequency Density × Class Width
- Frequency = 8 × 3 = 24
This means there are 24 items in this particular class interval.
Creating histograms from data tables
When you're given a frequency table and asked to draw a histogram, you need to:
- Calculate the class width for each interval - This is the difference between the upper and lower boundaries of each class.
- Calculate the frequency density for each class - Apply the formula to each row.
- Draw bars with heights equal to the frequency density values - The vertical position of each bar top corresponds to its frequency density.
- Ensure the bars are drawn with the correct widths - The horizontal width of each bar must match the class interval width.
| Length (mm) | Frequency |
|---|---|
| 0 < x ≤ 40 | 20 |
| 40 < x ≤ 60 | 45 |
| 60 < x ≤ 65 | 15 |
| 65 < x ≤ 100 | 70 |
The data table shown demonstrates how different class intervals can have different widths. For instance, one interval might span 20mm while another spans only 5mm. This is why we need frequency density rather than just frequency - it allows us to compare the data fairly across different interval widths.
Reading and interpreting histograms
When interpreting a histogram, remember that:
- The vertical axis shows frequency density, not frequency
- The area of each bar represents the frequency for that class interval
- Taller bars don't necessarily mean higher frequencies if the class widths are different
- You need to multiply frequency density by class width to get the actual frequency
Critical Point: Never assume that the tallest bar contains the most data! You must calculate the actual frequency by considering both the height (frequency density) and width (class width) of each bar.
This is why understanding the relationship between frequency, frequency density, and class width is so important for correctly interpreting histogram data.
Key Points to Remember:
- A histogram is a bar chart with bars of different widths
- The vertical axis always shows frequency density, not frequency
- Essential formula:
- To find frequency from a histogram:
- The area of each bar represents the frequency for that class interval
- Always consider both height and width when comparing bars in a histogram