Relative Frequency (Edexcel GCSE Maths): Revision Notes
Relative frequency
What is relative frequency?
Relative frequency is a statistical method used to estimate the probability of events occurring based on experimental data. When we conduct experiments or collect data, we can use relative frequency to work out how likely different outcomes are to happen.
The concept is particularly useful when we want to determine whether something is behaving fairly or if there might be some bias affecting the results.
Relative frequency bridges the gap between theoretical probability and real-world experimental results, making it an essential tool in statistics and data analysis.
Understanding the concept
When we conduct an experiment multiple times, we record how often each outcome occurs. This count is called the frequency. However, frequency alone doesn't tell us about probability - we need to compare it to the total number of trials we performed.
For example, if we know that rolling a three on a normal dice should theoretically happen 1 out of every 6 times, we can compare our experimental results to this expected outcome. If our results are significantly different from what we'd expect, this might indicate that the dice is biassed rather than fair.
The key insight is that relative frequency allows us to detect bias by comparing actual experimental results with theoretical expectations.
The relative frequency formula
The calculation for relative frequency is straightforward and forms the foundation of this topic:
This formula converts raw frequency data into a proportion that can be directly compared to theoretical probabilities or used to estimate the likelihood of future events.
Relative frequencies are always between 0 and 1, where 0 means the event never occurred and 1 means it occurred in every trial.
Calculating relative frequencies step by step
To calculate relative frequencies from your data, follow these steps:
- Count the frequency - Record how many times each outcome occurred
- Count the total trials - Add up all the frequencies to get your total number of experiments
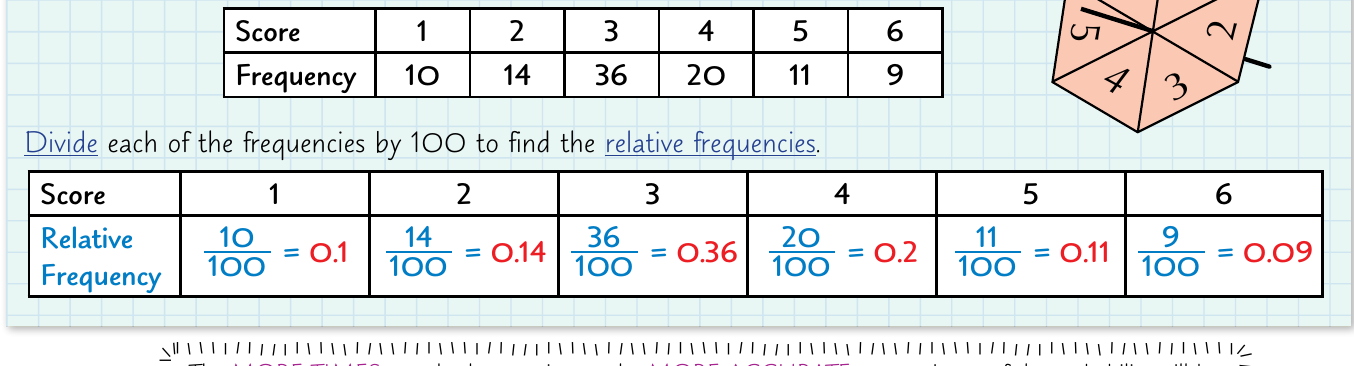
- Divide each frequency by the total - This gives you the relative frequency for each outcome
- Express as a decimal or percentage - Relative frequencies are usually written as decimals between 0 and 1
The example shows a spinner experiment where each outcome's frequency is divided by 100 (the total number of spins) to find the relative frequencies.
Worked Example: Spinner Results
If a spinner was spun 100 times with these results:
- Red: 25 times
- Blue: 30 times
- Green: 45 times
Calculate the relative frequencies:
- Red:
- Blue:
- Green:
Using relative frequency to estimate probability
Once you have calculated relative frequencies, you can use them to estimate probabilities for future events. The more times you repeat an experiment, the more accurate your probability estimates will become.
| Score | Frequency | |
|---|---|---|
| 1 | 140 | |
| 2 | 137 | |
| 3 | 138 | |
| 4 | 259 | |
| 5 | 161 | |
| 6 | 165 |
This is particularly important when dealing with real-world situations where theoretical probabilities might not apply due to manufacturing defects, bias, or other factors affecting the outcomes.
Sample Size Matters: Larger sample sizes generally produce more reliable estimates. The Law of Large Numbers tells us that relative frequencies approach true probabilities as the number of trials increases.
Determining if something is fair or biassed
Relative frequency is an excellent tool for detecting bias in experiments. Here's how to approach this:
For fair outcomes: All possible results should have similar relative frequencies. For example, a fair six-sided dice should show each number roughly of the time (approximately 0.17).
For biassed outcomes: Some results will appear much more or less frequently than expected. If one outcome has a much higher relative frequency than others, or if the pattern differs significantly from what you'd expect theoretically, this suggests bias.
When analysing results, look for outcomes that are "far away" from what you'd expect. If the relative frequencies show a clear pattern that doesn't match theoretical expectations, you can conclude that the object or system is probably biassed.
Critical Analysis: Always compare your experimental relative frequencies to the expected theoretical values. Significant deviations from expected values indicate bias, not randomness.
Worked examples and practice
The most effective way to understand relative frequency is through practical examples. When working through problems:
- Organize your data clearly - Use tables to show frequencies and calculations
- Show your working - Always demonstrate how you calculated each relative frequency
- Compare to expected values - Consider what the relative frequencies should be if the situation were fair
- Draw conclusions - State whether the evidence suggests bias and explain your reasoning
Remember that larger sample sizes generally give more reliable estimates. If you conducted 1000 trials instead of 100, your relative frequencies would likely be closer to the true probabilities.
When presenting your work, always include units and show clear step-by-step calculations. This makes it easier to spot errors and demonstrates your understanding of the process.
Key Points to Remember:
- Relative frequency =
- The more experiments you conduct, the more accurate your probability estimates become
- Use relative frequency to estimate probabilities when theoretical calculations aren't sufficient
- Compare relative frequencies to expected values to detect bias in systems
- Always show your calculations clearly and explain your reasoning when drawing conclusions about fairness
- Larger sample sizes produce more reliable results