Emission and Absorption Spectra (Grade 12 NSC Matric Physical Sciences): Revision Notes
Emission and Absorption Spectra
Introduction to atomic structure and spectra
Atoms contain electrons that are arranged in specific energy levels around the nucleus. Each element has a unique arrangement of these energy levels, which acts like a fingerprint for that element. When atoms interact with light energy, they can either absorb or emit photons at very specific wavelengths.
In the early 1900s, scientists made a fascinating discovery that would revolutionise our understanding of atomic structure. When they heated liquids or solids to high temperatures, they produced a broad range of light colours. However, when they heated gases to similar temperatures, the gases only emitted light at certain specific wavelengths. This observation led to the discovery of emission and absorption spectra.
Emission spectra
What is an emission spectrum?
An emission spectrum is the pattern of specific wavelengths of light that an element emits when its atoms are excited by heat or electrical energy. Each element produces its own unique emission spectrum, making it possible to identify elements by their characteristic light patterns.
The discharge tube experiment
Scientists studied emission spectra using a discharge tube - a gas-filled glass tube with metal plates at both ends. When a high voltage is applied across the tube, the following process occurs:
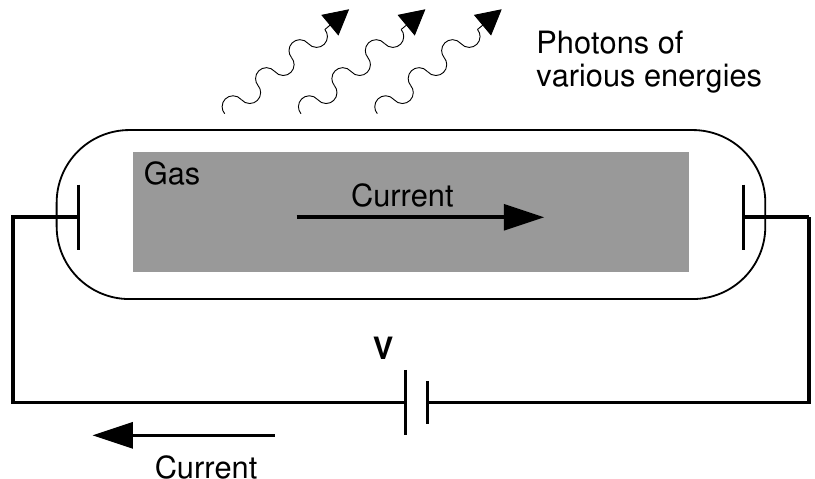
The Discharge Tube Process:
- The gas atoms absorb enough energy to become ionised
- Electrons are removed from atoms, creating a current flow
- The current excites atoms throughout the gas
- As excited electrons fall back to lower energy levels, they emit photons
- These photons create the characteristic emission spectrum for that gas
Hydrogen emission spectrum
When hydrogen gas is used in a discharge tube, it produces four visible spectral lines at specific wavelengths:
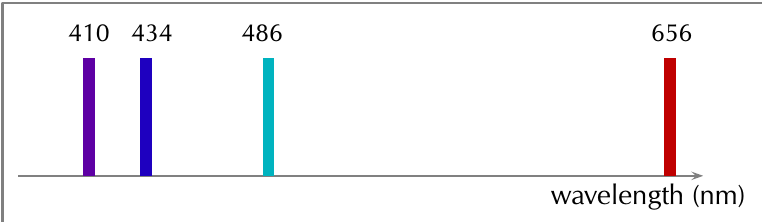
- 410 nm (violet)
- 434 nm (blue)
- 486 nm (cyan)
- 656 nm (red)
These lines represent the Balmer series of hydrogen, which consists of transitions ending at the second energy level (n=2).
Energy levels and electron transitions
The emission of light occurs when electrons transition between quantized energy levels within atoms. The energy level diagram shows how this process works:
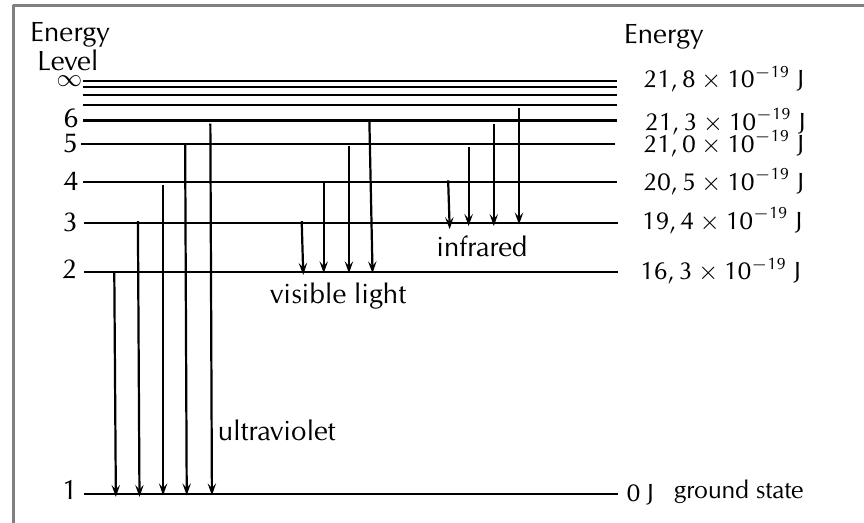
Key Principles of Electron Transitions:
- Electrons exist in discrete energy levels (not continuous)
- The ground state (n=1) has the lowest energy (0 J)
- Higher energy levels have increasingly negative energy values
- When electrons fall from higher to lower levels, they emit photons
The energy of the emitted photon equals the energy difference between the two levels:
Since photon energy relates to frequency through , and frequency relates to wavelength, each transition produces light of a specific colour.
Spectral series in hydrogen
Hydrogen's complete emission spectrum contains three main series based on which energy level the electron transitions end at:
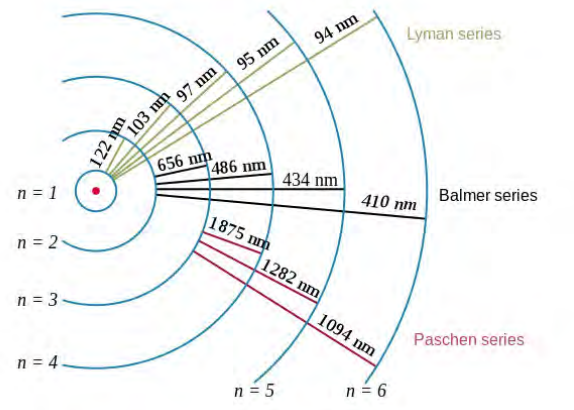
- Lyman series (ultraviolet): Transitions ending at n=1
- Wavelengths: 122 nm, 103 nm, 97 nm, 95 nm, 94 nm
- Balmer series (visible light): Transitions ending at n=2
- Wavelengths: 656 nm, 486 nm, 434 nm, 410 nm
- Paschen series (infrared): Transitions ending at n=3
- Wavelengths: 1875 nm, 1282 nm, 1094 nm
Each series produces different regions of the electromagnetic spectrum because the energy differences between levels vary.
Absorption spectra
What is an absorption spectrum?
An absorption spectrum is the pattern of dark lines that appear when white light passes through a cooler gas. These dark lines correspond exactly to the wavelengths that the gas would emit in its emission spectrum.
How absorption works
When photons hit atoms, electrons can absorb the photon's energy and jump to higher energy levels, but only if:
- The photon's energy exactly matches the energy gap between two levels
- If the energy doesn't match, the photon passes through unabsorbed
This creates gaps (dark lines) in the continuous spectrum at specific wavelengths where photons have been absorbed.
Relationship between emission and absorption
Critical Concept: The absorption spectrum is the exact inverse of the emission spectrum for the same element. The dark absorption lines occur at precisely the same wavelengths as the bright emission lines.
This occurs because:
- Emission: Electrons fall down energy levels, releasing photons
- Absorption: Electrons jump up energy levels, absorbing photons
- Both processes involve the same energy differences between levels
Worked example: Absorption spectrum calculation
Worked Example: Calculating Energy Level Transitions
Question: A gas shows an absorption line at 642 nm. Calculate which hydrogen energy levels are involved in this transition.
Solution:
Step 1: Calculate the photon energy Using :
Step 2: Find the energy level transition From the hydrogen energy level diagram, a transition from n=2 to n=3:
Step 3: Conclusion The absorption line corresponds to electrons jumping from energy level 2 to energy level 3 in hydrogen atoms.
Key exam tip: Remember that photon energy corresponds to the difference between energy levels, not the energy of a single level.
Applications of emission and absorption spectra
Spectroscopy in astronomy
Spectroscopy is the study of spectra to identify elements and their properties. Astronomers use this technique to:
Identify elements in stars:
- Each element produces unique spectral lines
- By analysing starlight, astronomers can determine stellar composition
- Different stars contain different elements in varying amounts
Measure galaxy velocities using the Doppler effect:
- Moving objects change the wavelength of light they emit
- Redshift: Object moving away - wavelengths appear longer (redder)
- Blueshift: Object moving towards us - wavelengths appear shorter (bluer)
- This allows precise measurement of galaxy velocities relative to Earth
Global warming and greenhouse gases
Emission and absorption spectra explain how greenhouse gases contribute to global warming:
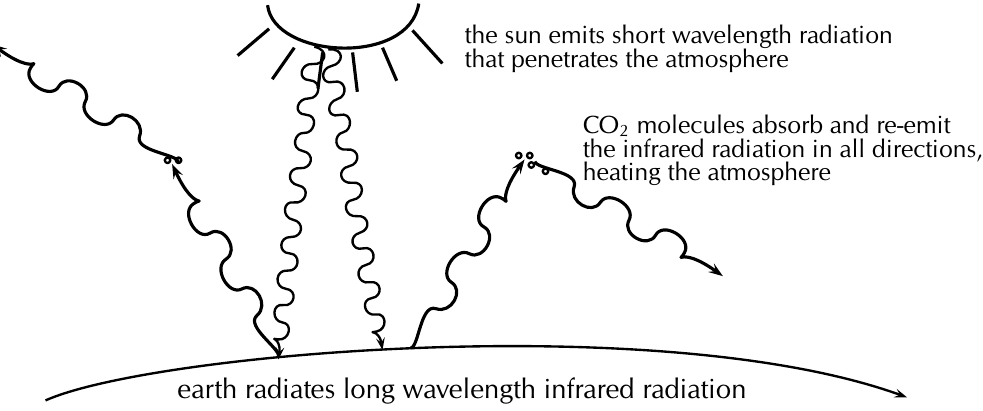
The Greenhouse Process:
- The Sun emits short wavelength radiation (visible light)
- This radiation passes through the atmosphere and warms Earth
- Earth radiates heat back as long wavelength infrared radiation
- Greenhouse gases (like CO₂) have energy levels matching infrared wavelengths
- These gases absorb the infrared radiation and re-emit it in all directions
- This traps heat in the atmosphere, causing global warming
Key Point: Different molecules absorb different wavelengths based on their energy level structure. CO₂'s energy levels match infrared radiation, making it an effective greenhouse gas.
Common exam tips
- Remember: Each element has a unique spectral fingerprint
- Energy calculations: Always use for wavelength problems
- Transitions: Emission = electrons falling down, Absorption = electrons jumping up
- Series names: Know that Balmer series is visible light ending at n=2
- Applications: Spectroscopy identifies elements; Doppler effect measures motion
Key Points to Remember:
- Emission spectra are created when excited electrons fall between energy levels, releasing photons at specific wavelengths unique to each element
- Absorption spectra show dark lines where photons are absorbed, causing electrons to jump to higher energy levels
- The photon energy always equals the energy difference between two levels:
- Spectroscopy allows astronomers to identify stellar composition and measure galaxy velocities through redshift and blueshift
- Greenhouse gases absorb infrared radiation because their molecular energy levels match infrared wavelengths, contributing to global warming