Conditional Probability Formulae (HSC SSCE Mathematics Advanced): Revision Notes
Conditional Probability Formulae
Understanding conditional probability
Conditional probability measures the likelihood of one event occurring when we know that another event has already occurred. We write this as , which reads as "the probability of event given event ".
When outcomes are equally likely, conditional probability represents the proportion of outcomes in both and relative to the outcomes in alone. This makes intuitive sense: once we know has occurred, our sample space effectively reduces to just the outcomes in .
When event occurs, we're no longer considering all possible outcomes in the sample space. Instead, we focus only on the outcomes within . This reduction of the sample space is the key insight behind conditional probability.
The two conditional probability formulae
There are two ways to express conditional probability, depending on the information available.
Formula 1: Using cardinality (for equally likely outcomes)
When all outcomes are equally likely, we can use:
Understanding the notation:
- is the probability of given , where
- is the number of outcomes in both and
- is the number of outcomes in
This formula is ideal when working with countable outcomes like survey data or finite sample spaces.
Formula 2: Using probabilities
When we have probabilities rather than counts, we use:
Where:
- is the probability of both and occurring
- is the probability of , where
This formula is particularly useful for solving practical problems where we need to calculate and first using tree diagrams or two-way tables.
Worked example 1: Student survey using Venn diagrams
Worked Example: Finding Conditional Probability from Survey Data
A survey of 100 students reveals that 60 like mathematics, 50 like science, and 30 like both subjects. We need to find the probability that a student likes mathematics given they like science.
Setting up the problem
We'll use the formula:
Let represent students who like mathematics and represent students who like science.
From the survey:
- (students who like both)
- (students who like science)
Calculating the conditional probability
Therefore, the probability that a student likes mathematics given they like science is .
Visualising with a Venn diagram
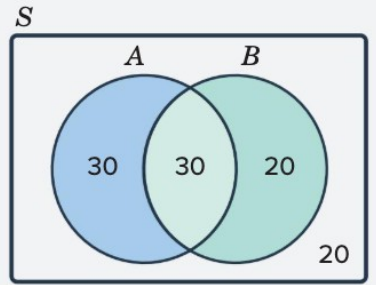
The Venn diagram helps verify our answer:
- Circle (mathematics) contains 30 students who only like mathematics, plus 30 in the overlap
- Circle (science) contains 20 students who only like science, plus 30 in the overlap
- The overlap contains 30 students who like both
- Outside both circles are 20 students who like neither subject
We can verify: students total.
Exam tip: Always check that the regions in your Venn diagram sum to the total number in the sample space. This helps catch calculation errors early.
Worked example 2: Quality control using tree diagrams
Worked Example: Using Tree Diagrams for Sequential Events
In a factory, 10% of items are defective. A test detects 90% of defective items but also falsely identifies 5% of non-defective items as defective. An item tests positive. What is the probability it is actually defective?
Setting up the problem
Let be the event that an item is defective and be the event that the test is positive.
We need to find using a tree diagram to calculate and first.
Creating the tree diagram
Assume 100 items for simplicity:
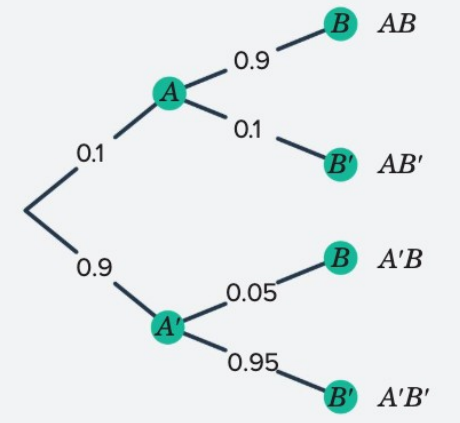
The tree diagram shows all possible paths:
- First branch: defective (0.1) or non-defective (0.9)
- Second branch: test positive or test negative
Calculating the required probabilities
From the tree diagram:
This represents defective items testing positive.
This represents non-defective items testing positive (false positives).
This represents all positive tests (both true and false positives).
Applying the conditional probability formula
Therefore, the probability that an item is defective given it tests positive is .
Exam tip: When using tree diagrams, ensure all probabilities at each branch point sum to 1. Also verify that includes all paths that lead to event occurring.
Choosing the right approach
Different problems require different methods. Understanding when to use each approach is essential for efficient problem-solving:
Method Selection Guide:
- Venn diagrams work well when you have survey data or can easily visualise overlapping groups
- Tree diagrams are ideal for sequential events or when calculating joint probabilities
- Two-way tables can organise categorical data effectively
The formula works with all these methods.
Remember!
Key Points to Remember:
- Conditional probability represents the probability of event occurring given that event has already occurred
- For equally likely outcomes:
- For general probability problems: where
- Tree diagrams help calculate by multiplying along branches and by adding all paths that lead to
- Always verify your answer makes sense: conditional probabilities must be between 0 and 1, and regions in Venn diagrams or tree diagram probabilities should sum correctly