Characteristics of Quadratics (HSC SSCE Mathematics Advanced): Revision Notes
Characteristics of Quadratics
What is a quadratic function?
A quadratic function is a function that can be written in the form:
where , , and are constants, and .
The condition is essential because if , the function becomes , which is a linear function, not a quadratic.
The graph of a quadratic function is always a smooth U-shaped curve called a parabola. The simplest quadratic function is .
Key features of parabolas
Every parabola has several important features that help us understand and sketch the function.
The parabola shape
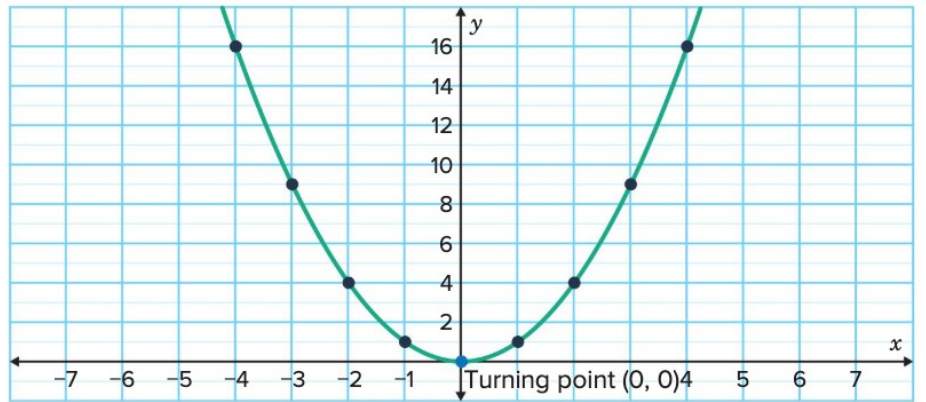
The graph of demonstrates the basic parabola shape. Here are some values:
Notice how the -values are symmetrical around . This creates the characteristic U-shape.
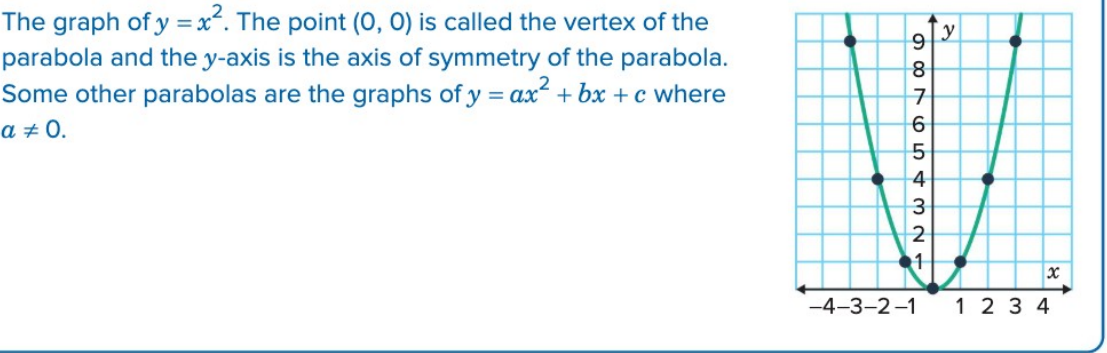
The symmetry in the table values demonstrates an important property: parabolas are always symmetric about their axis of symmetry. For , this line of symmetry is the y-axis itself ().
Vertex (turning point)
The vertex is the turning point of the parabola. It represents either the minimum value (when the parabola opens upward) or the maximum value (when the parabola opens downward).
For the basic parabola , the vertex is at the point .
Concavity
The concavity of a parabola describes the direction it opens:
- Concave up: The parabola opens upward like a smile. This happens when (the coefficient of is positive). The vertex is a minimum point.
- Concave down: The parabola opens downward like a frown. This happens when (the coefficient of is negative). The vertex is a maximum point.
The sign of in the quadratic function determines the concavity.
Memory Aid for Concavity:
- a positive = smile (concave up)
- a negative = frown (concave down)
Always check the sign of first when analyzing a parabola!
Intercepts
Intercepts are points where the parabola crosses the axes.
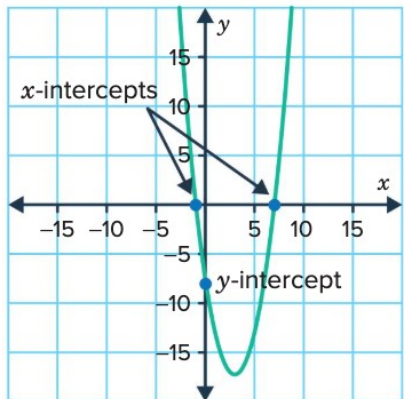
y-intercept: The point where the curve crosses the -axis. This occurs when . To find it, substitute into the equation. The -intercept is always at where is the constant term.
x-intercepts: The points where the curve crosses the -axis. These occur when . A parabola can have:
- Two x-intercepts
- One x-intercept (when the vertex touches the x-axis)
- No x-intercepts (when the parabola doesn't reach the x-axis)
The x-intercepts have many names! They are also called roots, zeroes, or solutions of the quadratic equation. These terms all mean the same thing.
Axis of symmetry
The axis of symmetry is a vertical line that divides the parabola into two mirror images. It always passes through the vertex.
For a quadratic function , the axis of symmetry has the equation:
where:
- is the coefficient of
- is the coefficient of
Formula for Axis of Symmetry:
Remember "b before 2a":
This formula is one of the most important tools for finding the vertex and sketching parabolas. Make sure you can recall and apply it quickly!
Finding key features: worked example
Let's identify the key features of the parabola .
Worked Example: Finding Key Features
Finding the y-intercept:
Substitute into the equation:
The y-intercept is (0, 3).
Finding the axis of symmetry:
Use the formula with and :
The axis of symmetry is x = 2.
Factored form and x-intercepts
When a quadratic function is written in factored form, finding the x-intercepts becomes straightforward.
The factored form of a quadratic function is:
where:
- and are the x-intercepts
- is the stretch factor (determines how wide or narrow the parabola is and its orientation)
Finding x-intercepts from factored form
To find the x-intercepts, set and solve:
Now set each factor equal to zero:
First factor:
Second factor:
Therefore, the x-intercepts are at and .
When a quadratic is in factored form, the x-intercepts can be read directly from the equation! This makes factored form extremely useful for quick analysis and graphing.
Worked example: finding x-intercepts
Worked Example: Finding x-intercepts from Factored Form
For the quadratic , find the x-intercepts.
Strategy: Set and solve for .
Solution:
Set each factor to 0:
The x-intercepts are x = 3 and x = -1.
Finding the y-intercept:
Substitute :
The y-intercept is (0, -6).
The discriminant and number of roots
The discriminant is a mathematical tool that tells us how many x-intercepts a parabola has without actually solving the equation.
For a quadratic function , the discriminant is:
where:
- (Greek letter delta) represents the discriminant
- is the coefficient of
- is the coefficient of
- is the constant term
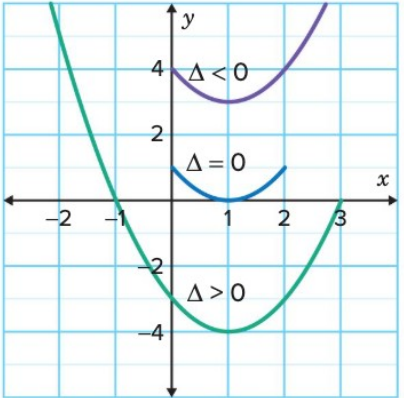
Interpreting the discriminant
The value of the discriminant tells us about the x-intercepts (roots):
Discriminant Rules:
-
If : Two distinct real roots (two x-intercepts)
- If is a perfect square, the roots are rational
- Otherwise, the roots are irrational
-
If : One real root (one x-intercept)
- The root is repeated and rational
- The parabola touches the x-axis at the vertex
-
If : No real roots (no x-intercepts)
- The parabola does not intersect the x-axis
Memory Aid: "Positive = two roots, Zero = one root, Negative = no roots"
The quadratic formula
The discriminant appears in the quadratic formula, which gives the roots of any quadratic equation where :
The term under the square root () is the discriminant.
Notice that when , we would need to take the square root of a negative number, which is why there are no real roots in this case!
Worked example: using the discriminant
Worked Example: Analyzing Roots Using the Discriminant
For :
Calculate the discriminant:
Since , there are two distinct real roots. Because is a perfect square (), the roots are rational.
Determine the parabola's position relative to the x-axis:
To fully understand the parabola's position, we also need to find the vertex.
The x-coordinate of the vertex is:
The y-coordinate of the vertex is:
The vertex is . Since , the parabola is concave up. With its minimum at below the x-axis and crossing it at two points (because ), the parabola has two x-intercepts.
Another worked example
Worked Example: Parabola with No x-intercepts
For :
Calculate the discriminant:
Determine the number and nature of x-intercepts:
Since , there are no real roots, and therefore no x-intercepts. The parabola does not cross the x-axis.
Domain and range
Domain
The domain of a function is the set of all possible input values (x-values).
For any quadratic function, the domain is all real numbers:
This means you can substitute any real number for in a quadratic function.
Unlike some other functions (such as square root or rational functions), quadratic functions have no restrictions on their input values. You can always calculate for any real number .
Range
The range of a function is the set of all possible output values (y-values).
For a quadratic function :
If (concave up): The parabola has a minimum value at the vertex. The range is:
where is the y-coordinate of the vertex.
If (concave down): The parabola has a maximum value at the vertex. The range is:
where is the y-coordinate of the vertex.
Worked example: domain and range
Worked Example: Finding Domain and Range
For :
Domain: The domain is (all real numbers).
Range:
First, find the vertex. The x-coordinate is:
Substitute into the function:
The vertex is .
Since , the parabola is concave up, and the range is:
Graphing quadratics
To sketch the graph of a parabola showing its key features, follow these steps:
- Calculate to determine the number of x-intercepts (if ), or determine them by factorising
- Find the y-intercept: Set , giving
- Find the vertex: Calculate , then find the corresponding y-value
- Determine concavity: Check whether (concave up) or (concave down)
- Plot the key points and sketch the parabola
Graphing Strategy:
Following these steps in order ensures you don't miss any important features. The discriminant tells you whether to look for x-intercepts, while the vertex and concavity determine the overall shape and position of the parabola.
Complete worked example
Worked Example: Complete Graph Sketch
Sketch the graph of showing key features.
From the previous example, we know:
- Discriminant: (no x-intercepts)
- Domain:
- Vertex:
- Range:
Find the y-intercept:
The y-intercept is (0, 4).
Sketch the graph:
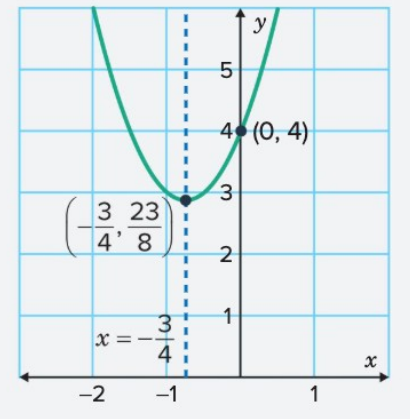
Plot the vertex at and the y-intercept at . Draw the axis of symmetry at . Since , sketch a concave up parabola that doesn't cross the x-axis.
Exam tips
Essential Exam Strategies:
- Always check the sign of a first to determine concavity
- Remember: the y-intercept is simply the constant term when
- Use the discriminant to save time - if , don't waste time trying to find x-intercepts
- The axis of symmetry always passes through the vertex
- When sketching, clearly label the vertex, intercepts, and axis of symmetry
Remember!
Key Points to Remember:
-
A quadratic function has the form where , and its graph is a U-shaped curve called a parabola
-
The vertex is the turning point, the axis of symmetry is the vertical line through the vertex given by , and concavity is determined by the sign of
-
The discriminant tells us the number of x-intercepts: two if , one if , and none if
-
In factored form , the x-intercepts are and
-
The domain of any quadratic is all real numbers (), while the range depends on the vertex and whether the parabola opens up or down