Determination of Molecular Structure by Spectroscopy (VCE SSCE Chemistry): Revision Notes
Determination of Molecular Structure by Spectroscopy
Introduction to spectroscopic analysis
Chemists identify unknown organic compounds by combining multiple analytical techniques. Each method reveals different structural information, which together forms a complete picture of the molecule's structure. This process resembles assembling pieces of a puzzle.
The main techniques used for organic structure determination are:
- Mass spectrometry (MS) - provides molecular mass and fragmentation pattern information
- Infrared spectroscopy (IR) - identifies functional groups present in the molecule
- Proton NMR spectroscopy - reveals hydrogen atom environments and connectivity
- Carbon-13 NMR spectroscopy - shows carbon atom environments
Chemical and physical properties can also provide useful clues about a compound's identity. Always consider supplementary data when available.
Systematic approach to structure determination
When identifying an unknown compound, follow this systematic five-step process:
Step 1: Determine the chemical formula
- Use the empirical formula and mass spectrum
- Identify the molecular ion peak (highest value)
Step 2: Determine the functional groups
- Use the IR spectrum
- Look for presence or absence of characteristic absorption bands
Step 3: Determine the hydrogen environments
- Use the H NMR spectrum
- Note the number of peaks, splitting patterns, relative peak areas, and chemical shifts
Step 4: Determine the carbon environments
- Use the C NMR spectrum
- Count the number of peaks and note chemical shift values
Step 5: Determine the structure
- Combine all evidence from steps 1-4
- Construct a structure consistent with all spectroscopic data
Chemical shift values may occasionally fall outside commonly quoted ranges, so use splitting patterns and peak areas first to identify environments.
Detailed example: structure determination of ethanol
Let's examine how different analytical techniques work together using ethanol as an example. This comprehensive analysis demonstrates the systematic approach to structure determination.
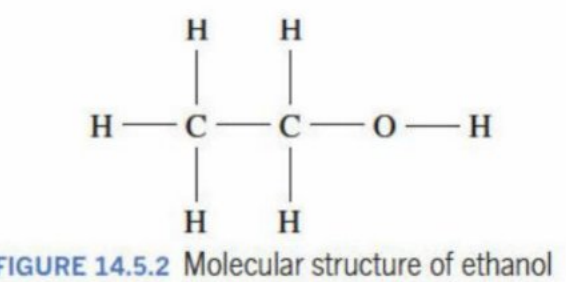
Worked Example: Complete Structure Determination of Ethanol
Mass spectrometry analysis
The mass spectrum provides information about molecular mass and fragmentation patterns.
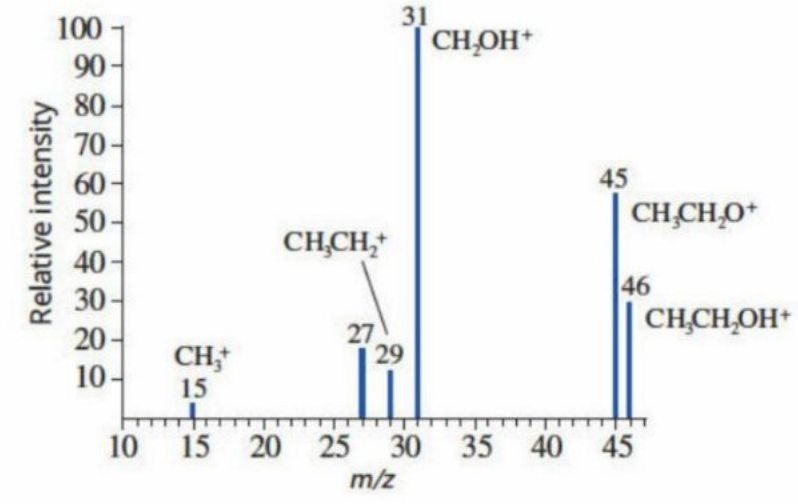
From the ethanol mass spectrum:
- The molecular ion peak appears at , indicating a relative molecular mass of 46
- Fragment ion peaks are visible and consistent with a molecule having the formula
- Key fragments include:
- at (base peak, 100% intensity)
- at
- at (molecular ion)
Infrared spectroscopy analysis
The IR spectrum reveals which functional groups are present.
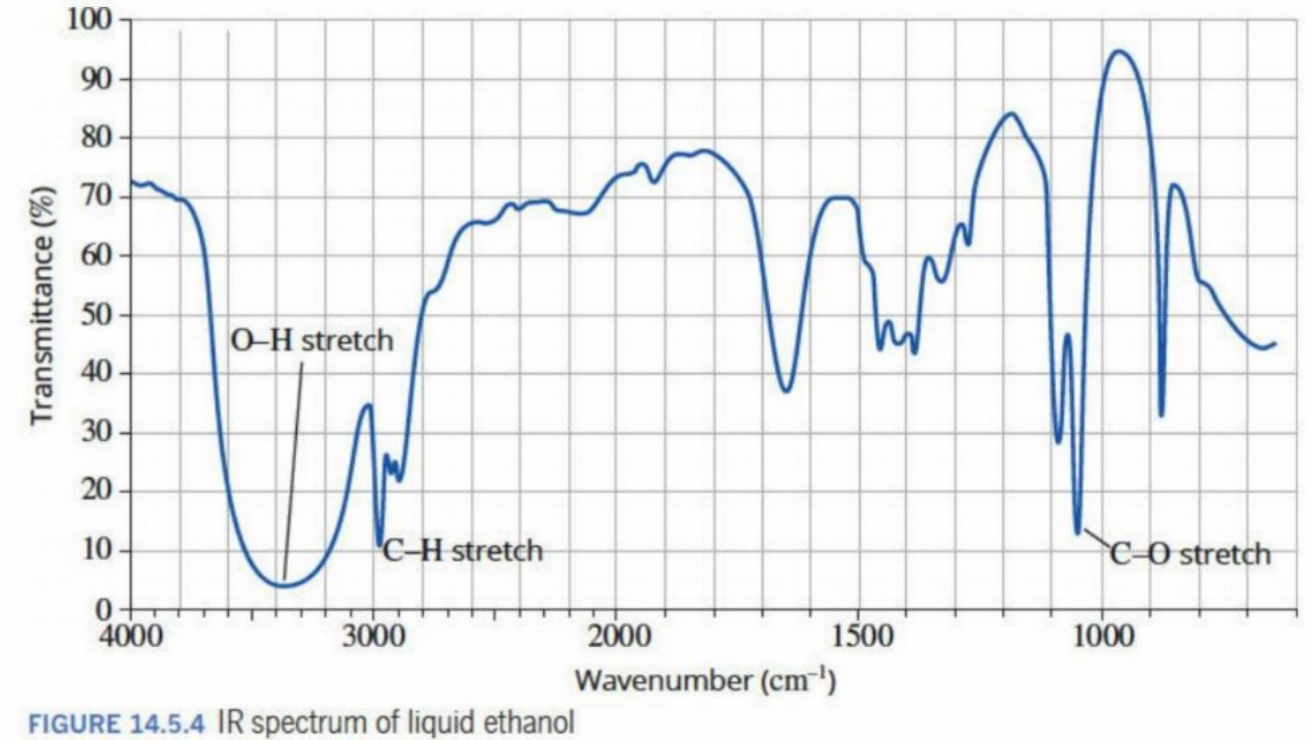
From the ethanol IR spectrum:
- A broad absorption band appears around due to the O–H bond, confirming an alcohol hydroxyl group
- No strong peak exists around , therefore no C=O bond is present
- Absorption bands from C–H and C–O bonds are also visible
These observations together confirm the presence of an alcohol but not an aldehyde, ketone, or carboxylic acid.
Proton NMR spectroscopy analysis
The H NMR spectrum shows the different hydrogen environments in the molecule.

From the ethanol proton NMR:
- Three signals appear, indicating three different hydrogen environments
- Signal at approximately :
- Four-line pattern (quartet)
- Relative peak area of 2
- Consistent with a –CH– group adjacent to a hydroxyl group
- Splitting pattern indicates three hydrogen atoms in the neighboring environment
- Signal at :
- Three-line pattern (triplet)
- Relative peak area of 3
- Consistent with a –CH group adjacent to a –CH– group
- Signal at :
- Singlet (one line)
- Consistent with an alcohol hydroxyl group
Hydrogen atoms on –OH groups typically do not split signals of adjacent hydrogen atoms. This is why the hydroxyl hydrogen appears as a singlet.
Carbon-13 NMR spectroscopy analysis
The C NMR spectrum reveals the different carbon environments.
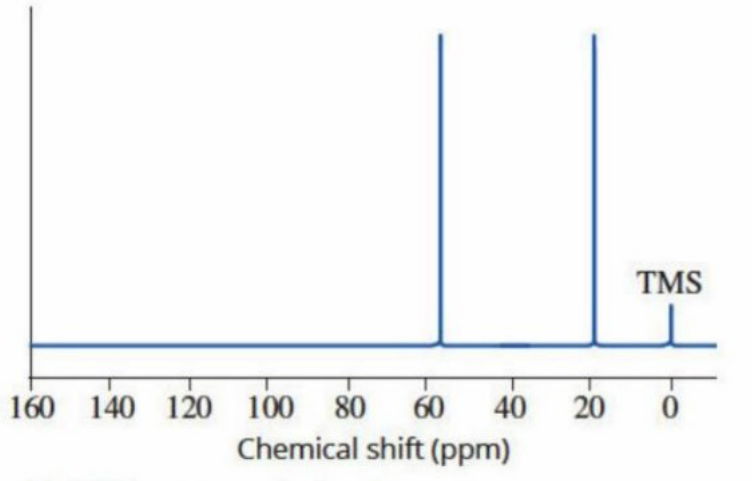
From the ethanol carbon-13 NMR:
- Two signals appear, indicating two different carbon environments
- Signal at :
- Corresponds to a carbon atom attached to a hydroxyl group (R–CH–OH)
- Signal at :
- Consistent with a methyl group (–CH)
Combining the evidence
When all spectroscopic information is assembled:
- Molecular formula:
- Contains an alcohol functional group (confirmed by IR and NMR)
- Has a –CH– group attached to –OH (from proton NMR)
- Has a –CH group (from proton and carbon-13 NMR)
- No carbonyl group present
The only structure consistent with all this data is CHCHOH (ethanol). Each spectrum contains the expected peaks for ethanol, and no inconsistent information appears in any spectrum. :::
Worked example: ethyl methanoate
A sweet-smelling liquid has the empirical formula . Chemical tests show the compound does not react with . Using spectroscopic data, we can determine its structure.
Worked Example: Structure Determination of Ethyl Methanoate
Step 1: Mass spectrum analysis
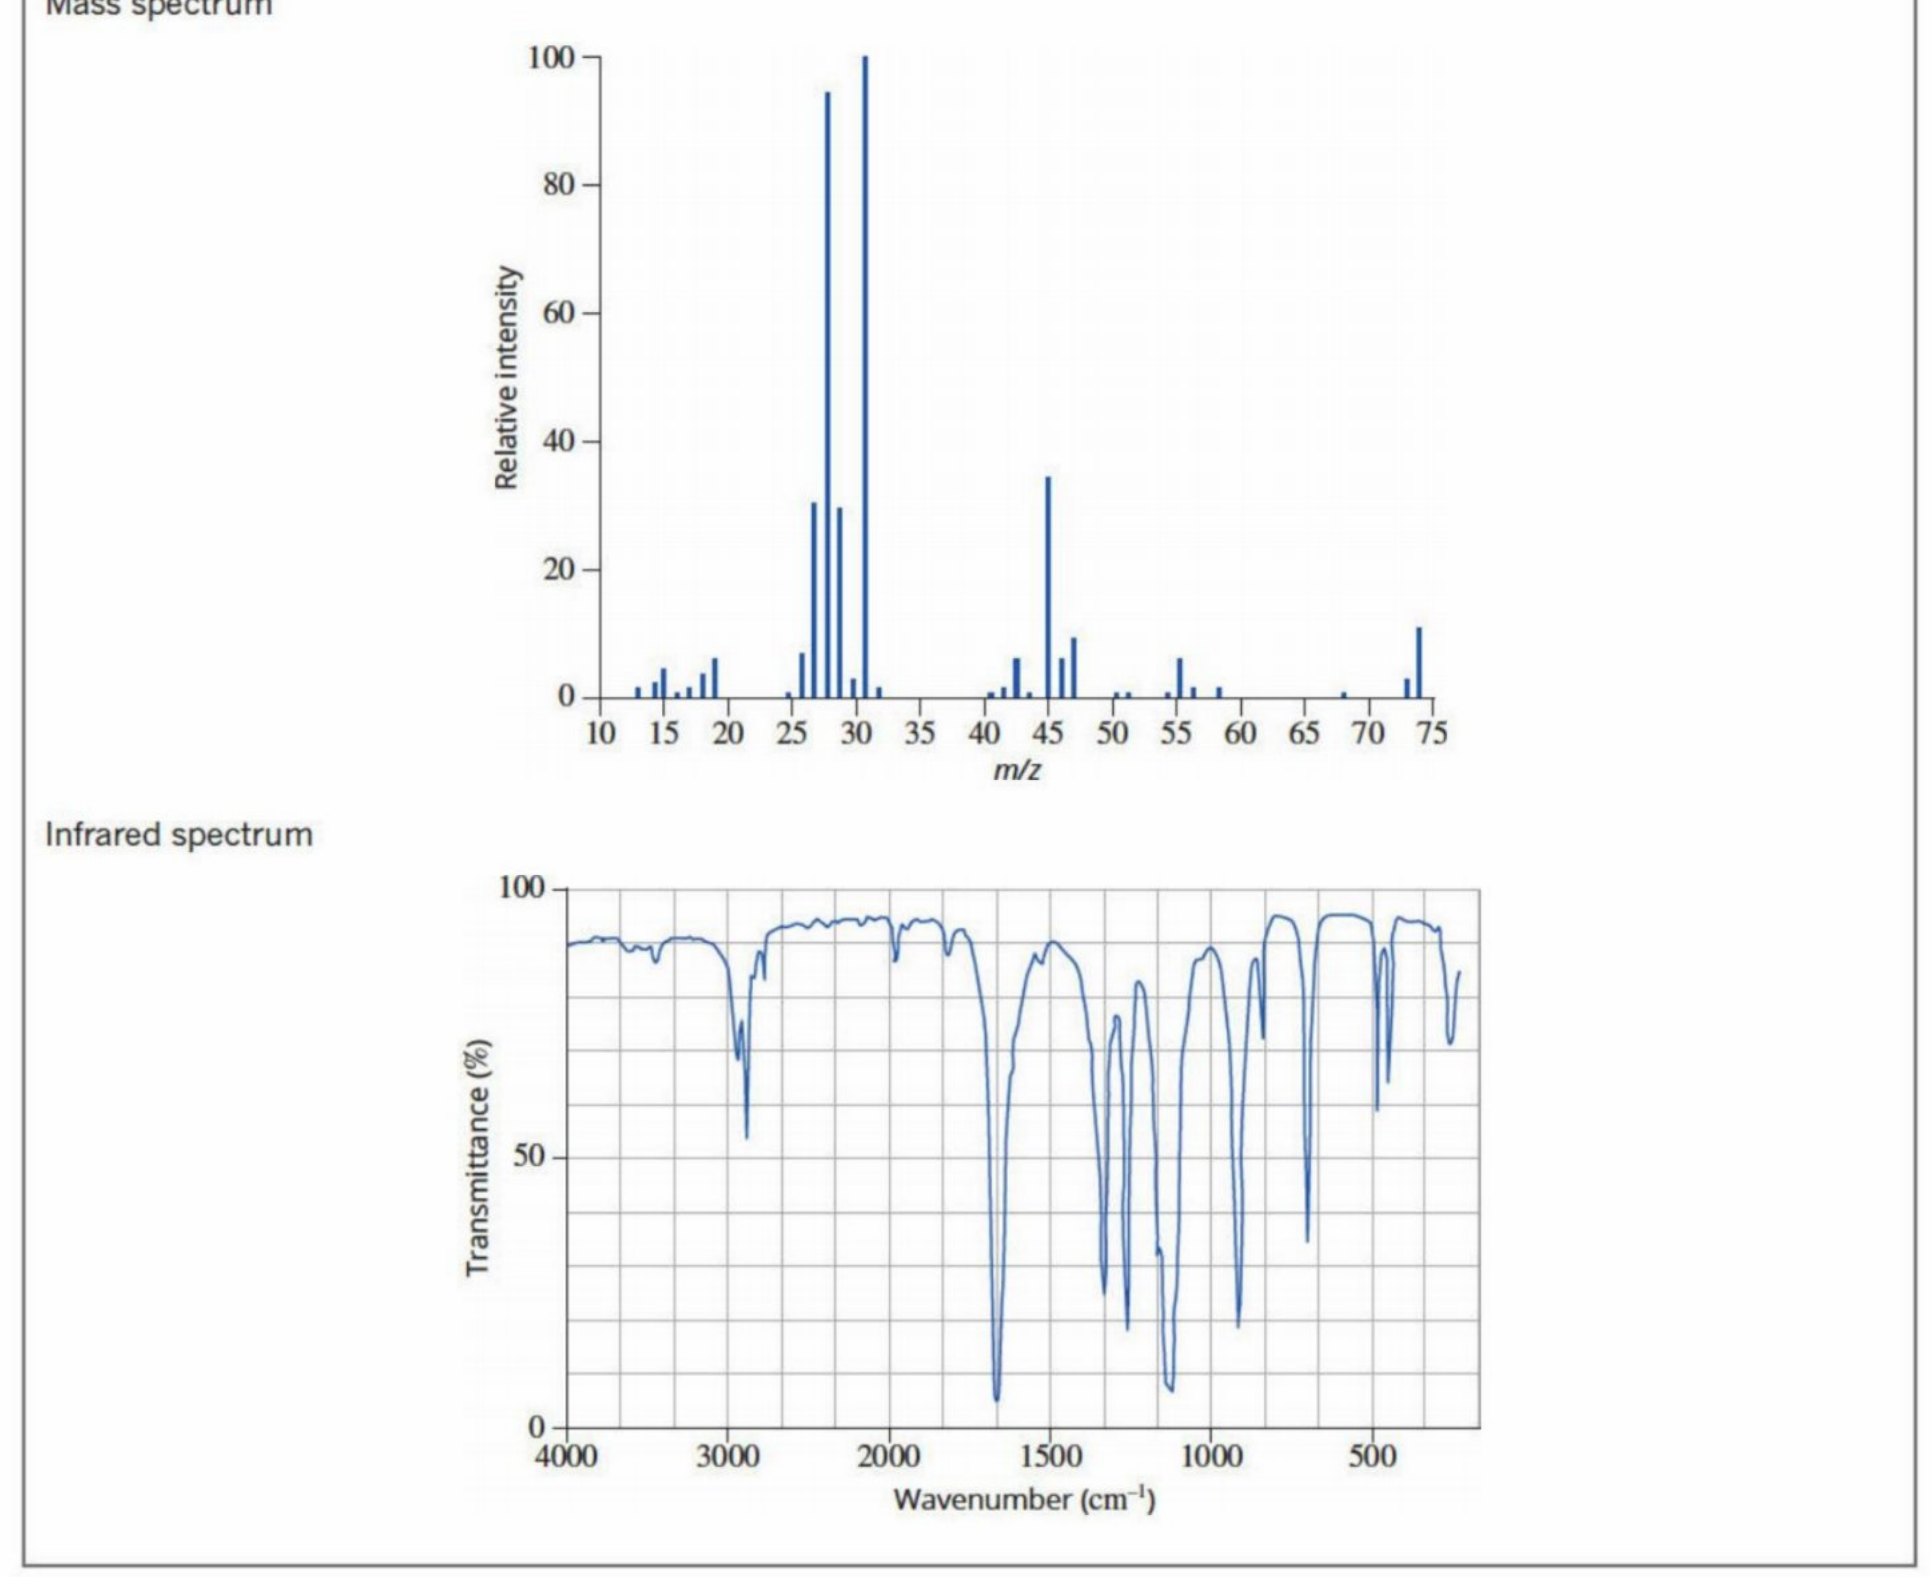
The peak with the largest mass-charge ratio appears at , so the relative molecular mass is 74. This mass is consistent with the molecular formula .
Step 2: IR spectrum analysis
The IR spectrum shows:
- A strong absorption band at , suggesting a C=O bond and therefore a carbonyl group
- No strong, broad absorption in the range , indicating no O–H bond
This combination suggests an ester functional group (carbonyl present, hydroxyl absent).
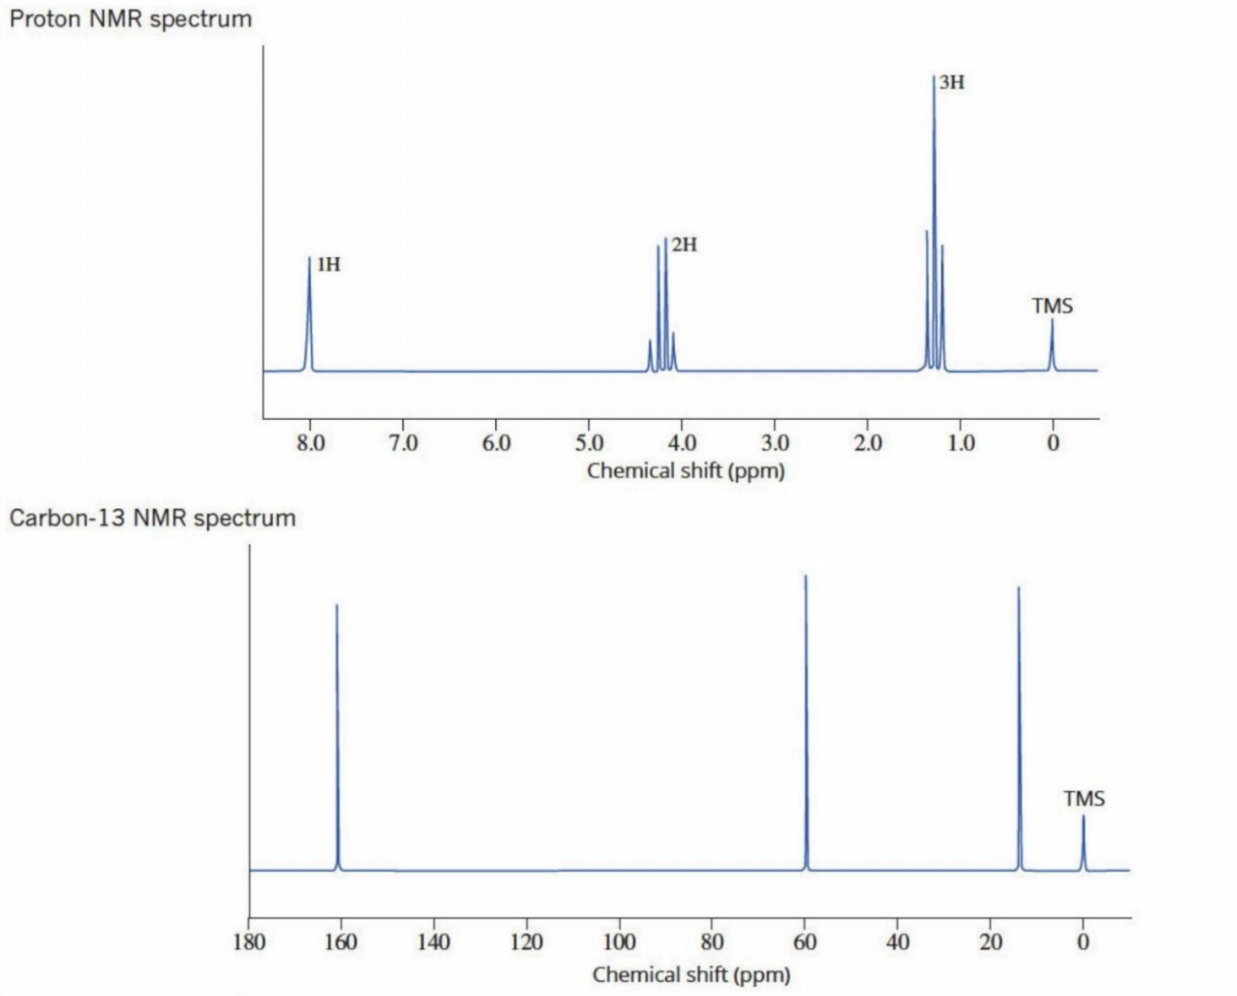
Step 3: Proton NMR analysis
The proton NMR data reveals three different hydrogen environments:
| Chemical shift (ppm) | Splitting pattern | Relative peak area |
|---|---|---|
| 1.3 | Triplet (3 lines) | 3 |
| 4.2 | Quartet (4 lines) | 2 |
| 8.0 | Singlet (1 line) | 1 |
Analysis:
- The sum of relative peak areas is 6, consistent with the molecular formula (each unit represents one hydrogen)
- Signal at :
- Relative area of 3 indicates a –CH group
- Triplet splitting indicates two neighboring hydrogen atoms
- Signal at :
- Relative area of 2 indicates a –CH– group
- Quartet splitting indicates three neighboring hydrogen atoms
- Chemical shift value corresponds to R–CH–O in an ester
- The triplet-quartet combination is typical of an ethyl group (CHCH–)
- Signal at :
- Singlet indicates no adjacent hydrogen atoms
- Large chemical shift suggests hydrogen attached to a carbonyl group
Step 4: Carbon-13 NMR analysis
The carbon-13 NMR shows three signals, indicating three different carbon environments:
- Signal at : consistent with a carbon atom in a carbonyl group
- Signal at : consistent with a carbon atom attached to oxygen by a single bond
- Signal at : consistent with a methyl group (R–CH)
Step 5: Structure determination
Combining all spectroscopic evidence:
- The compound contains a carbonyl group but no hydroxyl group
- It is an ester
- It contains a CHCH– group attached to oxygen
- It contains an HC=O group
The structure consistent with this data is:
This compound is ethyl methanoate.
Investigating mixtures and product purity
The challenge of analyzing mixtures
Most analytical chemists analyze mixtures rather than pure samples. A mixture's spectrum contains overlapping signals from all components, making direct identification extremely difficult.
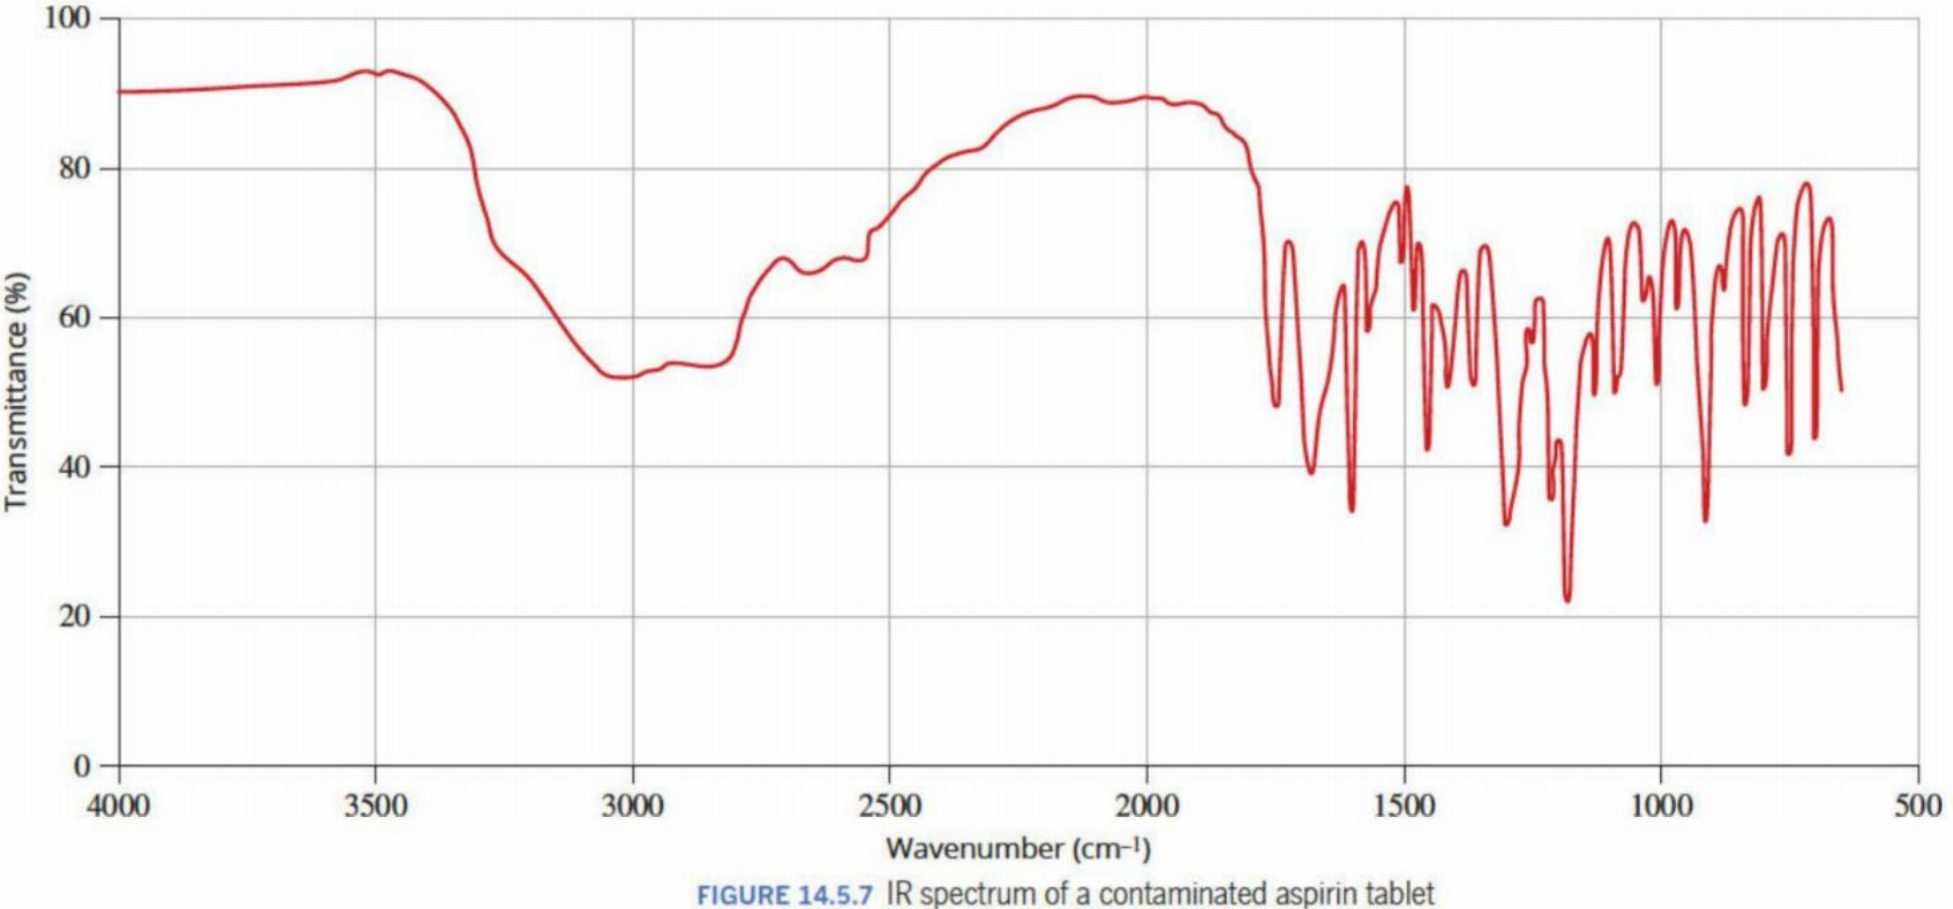
The IR spectrum of a contaminated aspirin tablet shows many peaks, but determining which peaks represent aspirin and which represent contaminants is impossible without additional information.
Using reference samples
Reference samples are known standards of either pure compounds or specific mixtures with measured and stored spectra in databases. These databases can contain spectra of hundreds of thousands of compounds.
To identify unknown components in a mixture:
- Compare the mixture's spectrum to the reference sample spectrum
- Subtract the known component's spectrum from the mixture spectrum
- Compare the remaining spectrum to a database
- Identify matches for the unknown components
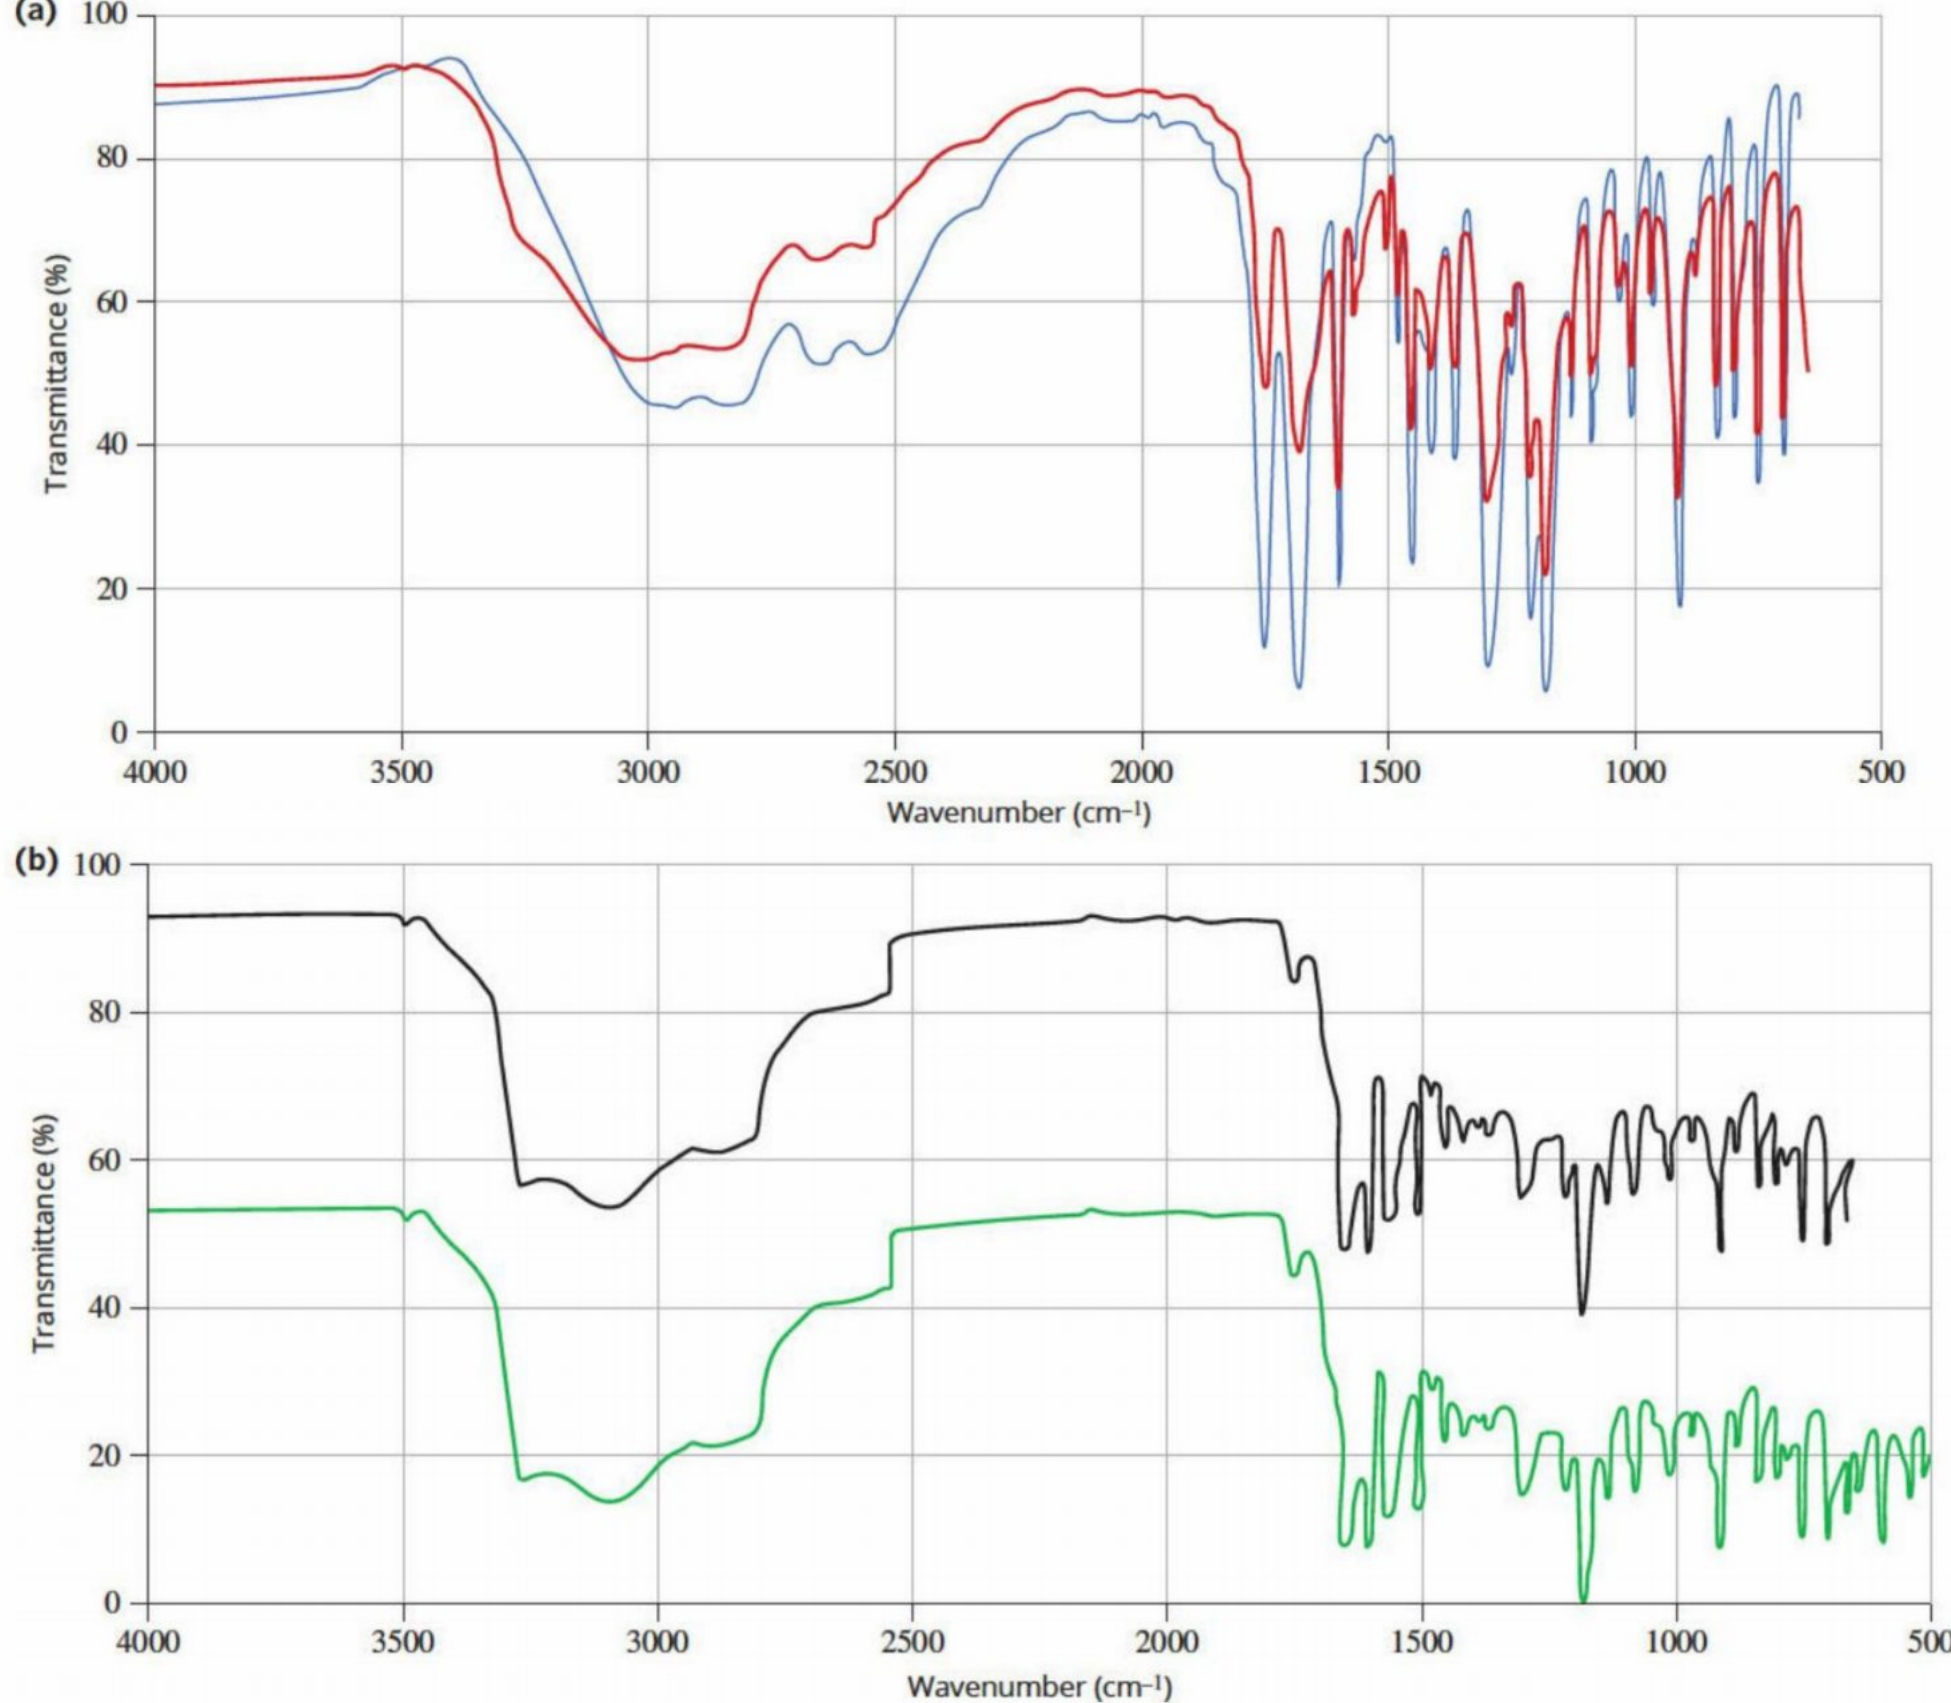
The figure shows how this works with aspirin:
- Panel (a): The reference aspirin spectrum (blue) is overlaid on the contaminated sample (red)
- Panel (b): After subtracting the aspirin spectrum, the remaining spectrum (black) matches paracetamol from the database (green)
Applications of reference samples
Detecting honey adulteration
Adulteration is the addition or substitution of an ingredient of lesser quality and cost. Some honey products have been diluted with sugar syrup but sold as 100% pure honey.
NMR spectroscopy provides a method to detect this fraud. Researchers:
- Collected reference spectra of authentic honey and sugar syrup
- Analyzed test honey samples
- Used statistical analysis to compare chemical shifts and splitting patterns
- Determined whether the sample was adulterated
This application demonstrates the power of spectroscopy in food authentication and quality control. The method can detect even small amounts of adulterants that would be difficult to identify by other means.
Mass spectrometry of mixtures
For complex mixtures:
- High-performance liquid chromatography (HPLC) can be coupled with mass spectrometry (HPLC-MS)
- The HPLC separates mixture components
- The mass spectrometer analyzes each component separately
- Mass spectra are compared to databases for identification
- Results are confirmed by analyzing pure samples and checking that retention times and spectra match
- Concentrations are determined by analyzing standard solutions
Testing sample purity
Here is the systematic approach to determining if a sample is pure:
- Analyze the sample using MS, IR, or NMR to collect spectra
- Compare your sample's spectra to a reference sample
- Check if the spectra match and look for additional or missing peaks
- If spectra match with no additional or missing peaks → sample is pure
- If spectra don't match or extra/missing peaks appear → sample is not pure
Key considerations for purity testing:
- For a sample to be 100% pure, there must be no additional or missing peaks compared to the reference
- Ensure your sample is dissolved in the same solvent as the reference sample
- Intermolecular forces between solvent and sample can change peak wavenumbers or chemical shifts
- Statistical analysis and computer modelling are typically required for complex mixture analysis
NIST databases
The National Institute of Standards and Technology (NIST) in the United States maintains one of the most established spectroscopy databases. Their free online Chemistry Webbook allows users to search for mass spectra and IR spectra data for tens of thousands of molecules. Most analytical laboratories worldwide use these databases to identify unknown compounds.
The NIST databases are freely accessible online and serve as an invaluable resource for chemists worldwide. They represent decades of accumulated spectroscopic data and are constantly being updated with new compounds.
Key Points to Remember:
- Use all spectroscopic techniques together - each provides different structural information that complements the others
- Follow a systematic approach - determine molecular formula first, then functional groups, then hydrogen and carbon environments, and finally combine all evidence
- The molecular ion peak in mass spectrometry appears at the highest value and equals the compound's molecular mass
- IR spectroscopy identifies functional groups - look for characteristic absorption bands such as O–H (broad, ), C=O (), and C–H ()
- NMR splitting patterns reveal neighboring atoms - in proton NMR, the number of lines equals where is the number of neighboring hydrogen atoms
- Reference samples are essential for mixture analysis - compare unknown sample spectra to known standards from databases to identify components and determine purity