Graphs and Networks (VCE SSCE General Mathematics): Revision Notes
Graphs and Networks
What are graphs?
In mathematics, a graph is a diagram that shows connections between different objects or people. Graphs are useful for representing many real-world situations. For instance, towns can be connected by roads, computers link together through the internet, and people form connections on social media platforms. These relationships and connections can all be modelled using graphs.
Vertices and edges
Let's explore how graphs work using a social media example. Six people (Anna, Brett, Cora, Dario, Ethan and Frances) have connections on a social media website. We can show their friendships using a graph.
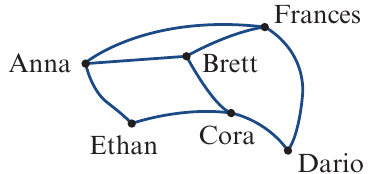
In this graph:
- Each person is represented by a dot, called a vertex (plural: vertices)
- The lines joining vertices together are called edges
- Each edge shows a friendship connection between two people
For example, Anna is friends with Brett, Ethan and Frances. We can see this because there are edges connecting Anna's vertex to the vertices representing Brett, Ethan and Frances.
Degree of a vertex
When we count how many edges are connected to a particular vertex, this count is known as the vertex's degree.
Looking at our social media example, Anna has three friends. This means the vertex representing Anna has three edges attached to it. Therefore, the degree of Anna's vertex is 3.
Symbolic notation: We can represent vertices using letters. If we let represent the vertex for Anna, we can write the degree as:
Odd and even degrees:
- A vertex has an odd degree if an odd number of edges connect to it
- A vertex has an even degree if an even number of edges connect to it
In our example, Anna has degree 3 (odd), while Dario has degree 2 (even).
Loops
A loop is a special type of edge that connects a vertex back to itself. Imagine if Ethan could add himself as a friend on the social media website. This self-connection would be represented by a loop.
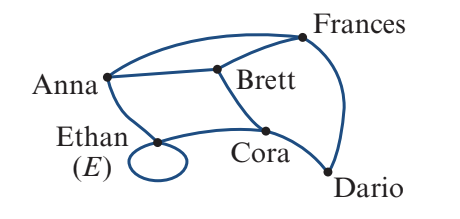
A loop attaches to a vertex twice (once at each end), so it contributes two degrees to that vertex.
For example, if Ethan () has a loop plus two other connections, then:
(2 degrees from the loop + 2 degrees from the other edges)
Key facts about edges, vertices and loops:
- A graph consists of vertices joined by edges
- The degree of a vertex counts how many edges attach to it
- Loops connect a vertex to itself and count as 2 degrees
Types of graphs
Graphs can have different characteristics, which helps us classify and describe them.
Simple graphs
A simple graph has two key features:
- No loops
- No multiple edges (no more than one edge between any pair of vertices)
Simple graphs are the most straightforward type of graph to work with.
Isolated vertices
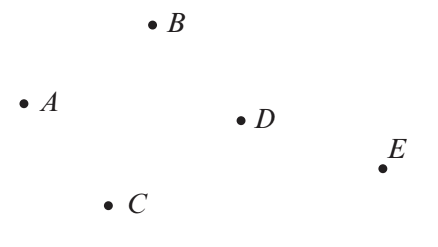
An isolated vertex is a vertex that has no edges connecting it to any other vertex in the graph. In other words, it stands alone with degree 0.
Degenerate graphs
A degenerate graph consists entirely of isolated vertices. This means the graph has no edges at all. Every vertex in a degenerate graph has degree 0.
Connected graphs
A connected graph is one where every vertex can reach every other vertex, either:
- Directly: by a single edge, or
- Indirectly: by travelling along a sequence of edges through other vertices
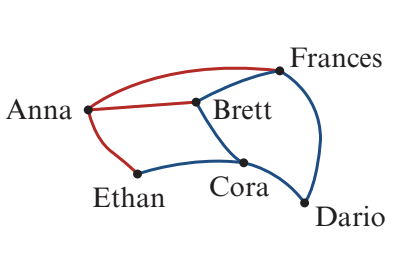
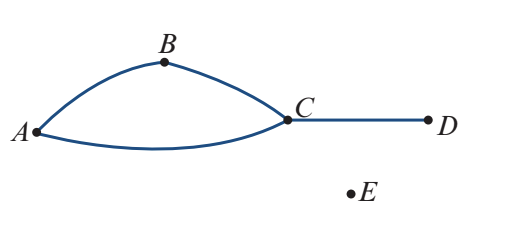
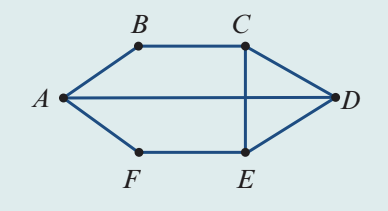
Bridges: A bridge is a critical edge in a connected graph. If you remove a bridge, the graph becomes disconnected, splitting into two separate parts that are no longer connected to each other.
In the diagram above, the edge connecting vertex to vertex acts as a bridge. Removing it would separate the graph into two disconnected components.
Complete graphs
In a complete graph, there is an edge between every possible pair of vertices. This represents maximum connectivity - every vertex is directly connected to every other vertex in the graph.
Subgraphs
A subgraph is formed by taking part of a larger graph. For a graph to be a valid subgraph of another graph:
-
All vertices in the subgraph must exist in the original graph
-
All edges in the subgraph must exist in the original graph
-
No extra vertices or edges can be added
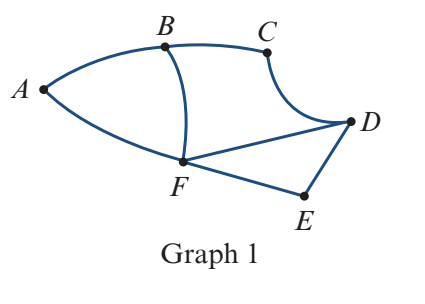
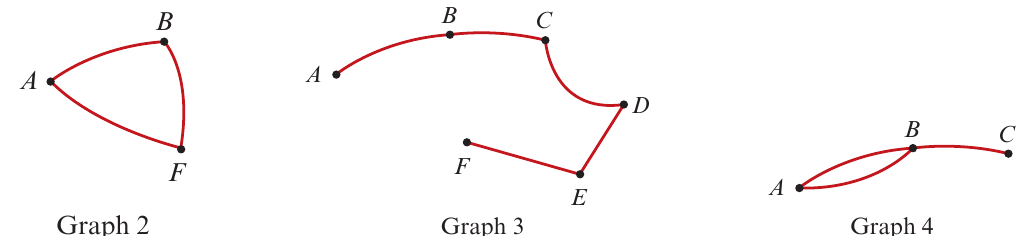
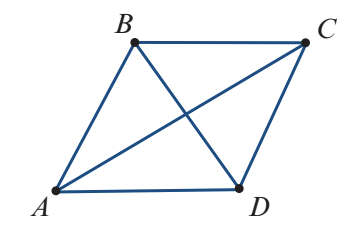
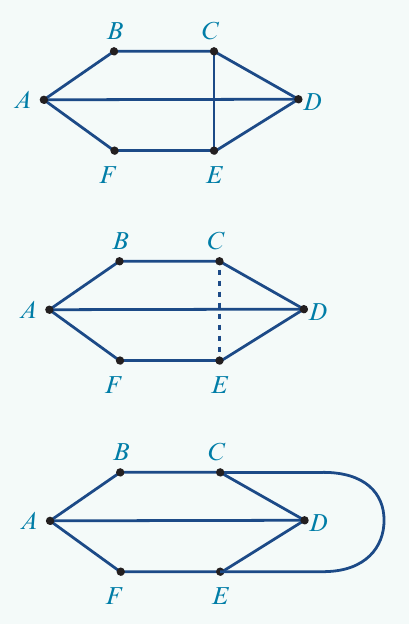
Looking at the diagrams, Graphs 2 and 3 are valid subgraphs of Graph 1 because all their vertices and edges appear in Graph 1. However, Graph 4 is not a subgraph of Graph 1 because it shows two edges between vertices and , while Graph 1 only has one such edge.
Equivalent (isomorphic) graphs
Here's an important principle: the visual layout of a graph doesn't matter - what matters is the connections between vertices.
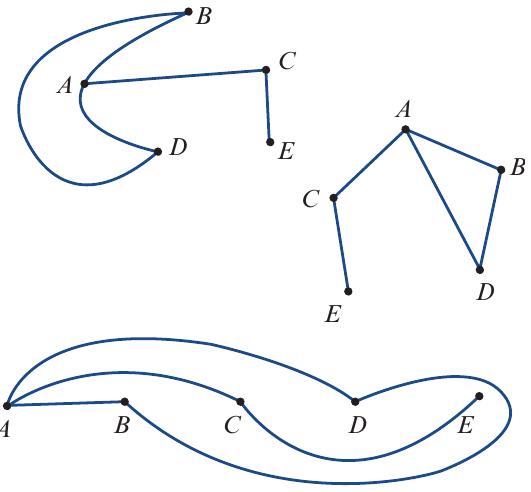
All the graphs shown above contain exactly the same information. They all show the same connections between vertices (for example, vertex connects to vertex in all versions, and vertex connects to vertices , and ).
These graphs are called equivalent graphs or isomorphic graphs. Even though they look different visually, they represent identical information because:
- They have the same vertices
- They have the same edges connecting the same pairs of vertices
The position of vertices and whether edges are curved or straight doesn't change the fundamental structure of the graph.
Planar graphs
Sometimes a graph has edges that cross over each other when drawn. However, it's important to note that crossing edges don't create a vertex at their intersection point.
Think of edges as insulated electrical wires - two wires can cross without touching or interfering with each other.
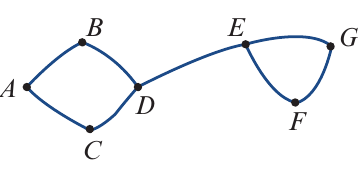
Definition
A graph is planar if it can be redrawn so that no edges cross over each other, like the example below.
If it's impossible to redraw the graph without edge crossings, it is called non-planar.
Redrawing graphs in planar form
To show that a graph is planar, follow these steps:
-
Identify an edge that crosses another edge
-
Temporarily remove the crossing edge from your diagram
-
Redraw that edge connecting the same two vertices, but route it so it doesn't cross any other edges
This process might need to be repeated for multiple crossing edges until you have a version with no crossings.
Exam tip: When redrawing a graph in planar form, remember that you can be creative with edge placement. Edges can curve, bend around vertices, or take any path as long as they connect the correct vertices without crossing.
Faces in planar graphs
Once a graph is drawn in planar form (with no crossing edges), it divides the paper into distinct regions called faces.
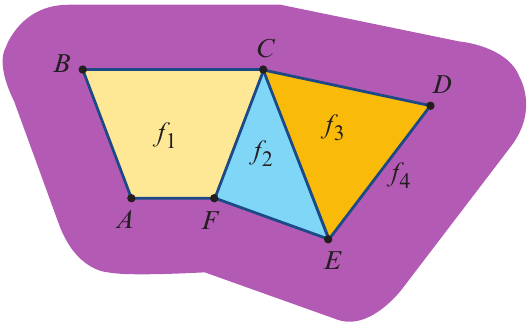
What is a face? A face is an enclosed region bounded by edges. Think of faces as areas you could colour in.
Don't forget to count the outer face - the infinite region outside the graph that extends across the rest of the paper. This is often labelled or similar and is easy to overlook.
In the diagram above, there are four faces in total: , , , and (the outer face).
Euler's formula
Leonard Euler (pronounced 'oiler') was one of history's most productive mathematicians. He discovered a remarkable relationship between the components of planar graphs, which forms the foundation of a branch of mathematics called topology.
Euler's formula:
where:
- = number of vertices
- = number of faces
- = number of edges
This formula applies to any connected planar graph.
Verifying Euler's formula
Let's verify Euler's formula using a worked example.
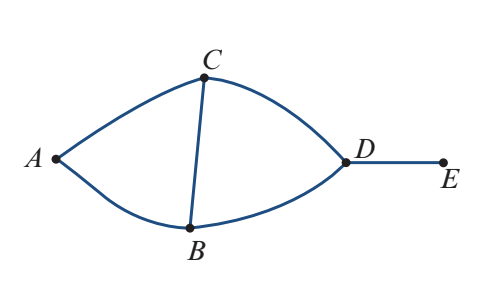
Worked Example: Verifying Euler's Formula
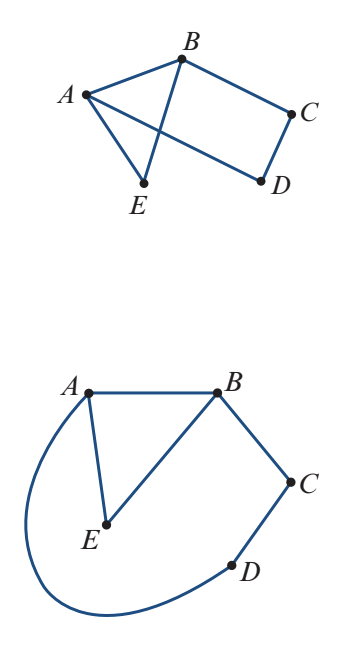
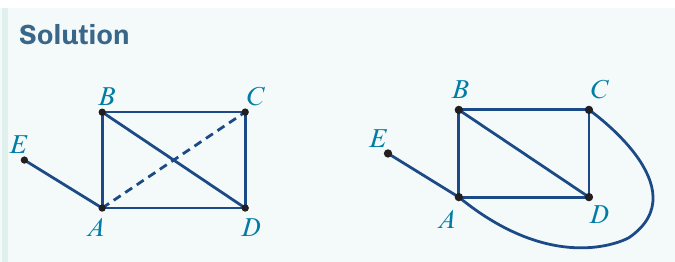
For the graph shown, verify Euler's formula.
Solution:
First, we need to redraw the graph in planar form so we can count the faces.
Now we count each component:
- Vertices: There are 5 vertices (, , , , )
- Edges: There are 7 edges
- Faces: There are 4 faces (including the outer face)
Substitute into Euler's formula:
✓
Since both sides equal 9, Euler's formula is verified for this graph.
Using Euler's formula to find unknown values
We can rearrange Euler's formula to find the number of vertices, edges, or faces when we know the other two values.
Worked Example: Finding the Number of Faces
A connected planar graph has 6 vertices and 9 edges. How many faces does it have?
Solution:
Given:
Using Euler's formula:
The graph has 5 faces (including the outer face).
Exam tip: Always remember to include the outer face in your count. A common mistake is to forget this face because it extends beyond the graph's visible boundaries.
Worked example: graph analysis
Worked Example: Comprehensive Graph Analysis
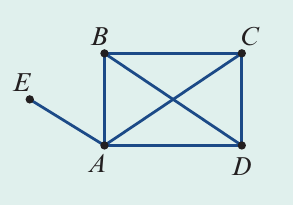
A connected graph is shown. Find:
a) The degree of vertex
b) Which vertices have loops
c) The degree of vertex
d) Which vertices are connected by a bridge
e) A subgraph involving only vertices , and
Solutions:
a) To find , count the edges attached to vertex . There are 4 connections, so:
b) A vertex has a loop if an edge connects it back to itself. Looking at the graph, vertices and both have loops.
c) Count the edges attached to vertex . Remember that a loop counts as 2 degrees.
Vertex has:
- One loop (contributes 2 degrees)
- Three other edges (contribute 3 degrees)
Therefore:
d) A bridge is an edge that, if removed, would disconnect the graph. The bridge exists between vertices and .
e) There are several possible subgraphs involving vertices , and . Here are some examples - any of these would be correct as long as all vertices and edges shown exist in the original graph.
Key Points to Remember:
- Graphs show connections between objects or people using vertices (dots) and edges (lines)
- The degree of a vertex is the number of edges attached to it, written as
- Loops connect a vertex to itself and contribute 2 degrees
- Planar graphs can be redrawn without crossing edges, creating distinct faces (regions)
- Euler's formula for planar graphs is (vertices + faces = edges + 2)
- The outer face (the infinite region outside the graph) must always be counted when determining the number of faces