Scheduling Problems (VCE SSCE General Mathematics): Revision Notes
Scheduling Problems
What is scheduling?
Scheduling is the process of allocating time to complete activities within a project. When a project involves multiple tasks, knowing how long each individual activity will take helps project managers to:
Benefits of effective scheduling:
- Hire appropriate staff
- Book necessary equipment
- Estimate overall project costs
- Determine the minimum time needed to complete the entire project
Scheduling problems focus on analysing activities to find the shortest possible time to finish a project.
Weighted precedence tables
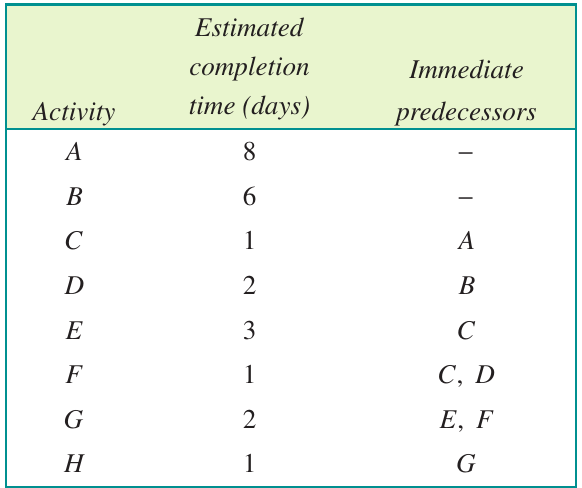
A precedence table shows the relationship between activities in a project. It lists:
- Each activity (usually labelled with letters)
- The estimated duration (time) for each activity
- The immediate predecessors (which activities must be completed before this one can start)
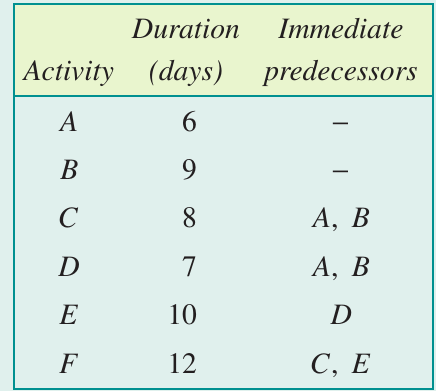
Here's an example of a weighted precedence table:
Key points about precedence tables:
- Activities with no immediate predecessors can start at the beginning of the project
- Some activities cannot begin until one or more other activities are finished
- The durations are called weights and represent the time each activity takes
Dummy activities
Sometimes when drawing an activity network, we need a dummy activity. This happens when:
- An activity appears more than once in the immediate predecessors column
- We need to show dependencies without representing an actual task
Critical rule for dummy activities:
The duration (weight) of dummy activities is always zero.
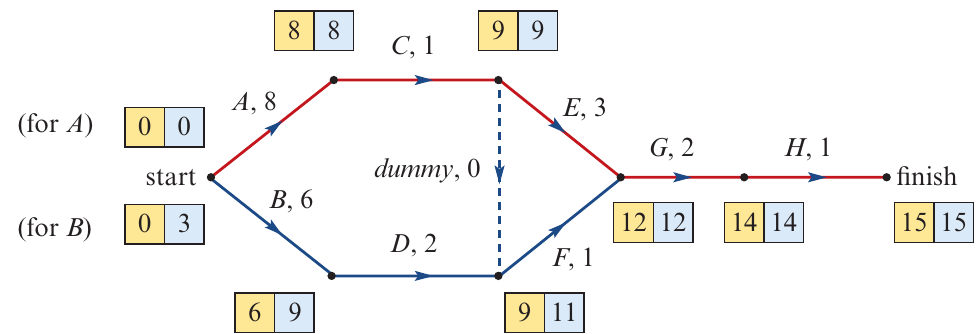
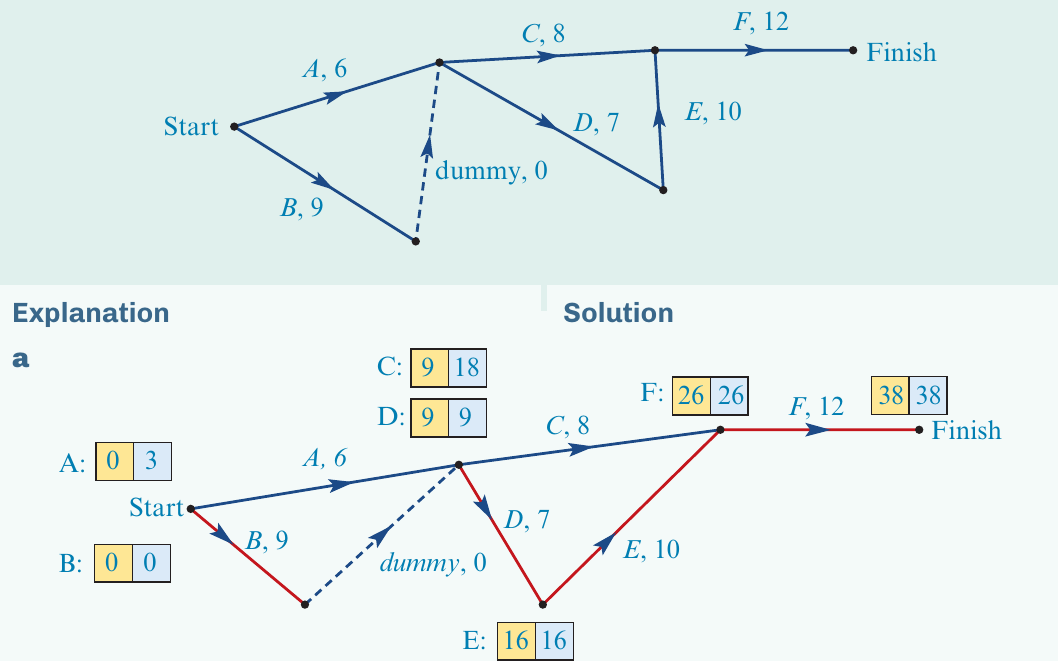
Here's the activity network for the precedence table above:
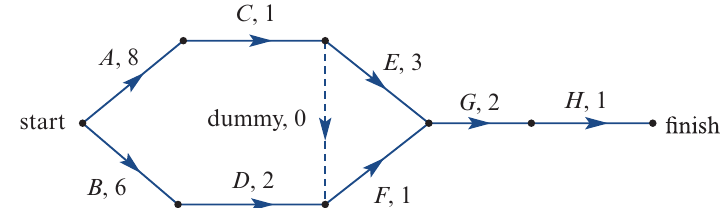
Notice the dummy activity shown with a dashed line - it has a duration of 0.
Float times
Float time (also called slack time) is the amount of flexibility around when an activity can start without delaying the entire project.
Consider this small section of an activity network:
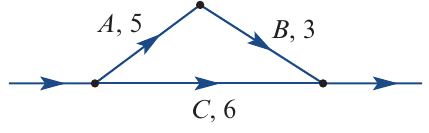
In this example:
- Activity B cannot begin until activity A is finished
- Both activities B and C must be complete before the next activity can start
- Activity C can happen at the same time as activities A and B
Calculating Float Time:
Activities A and B together take: hours
Activity C only takes: hours
Float time for activity C: hours
Result: Activity C has 2 hours of flexibility - it can be delayed by up to 2 hours without affecting the overall project completion time.
The table below shows different scenarios for starting activity C:
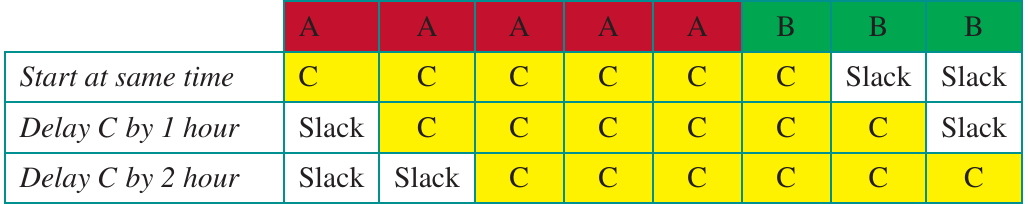
Activity C should not be delayed by more than 2 hours, as this would delay the entire project.
Earliest starting time (EST)
The earliest starting time (EST) for an activity is the earliest time after the start of the whole project that the activity can begin.
- An EST of 0 means the activity can start immediately when the project begins
- An EST of 8 means the activity can start 8 time units (hours, days, weeks, etc.) after the project begins
Forward scanning
Forward scanning is the method used to calculate EST values for all activities. Here's the step-by-step process:
Step 1: Draw a box split into two cells next to each vertex where an activity begins
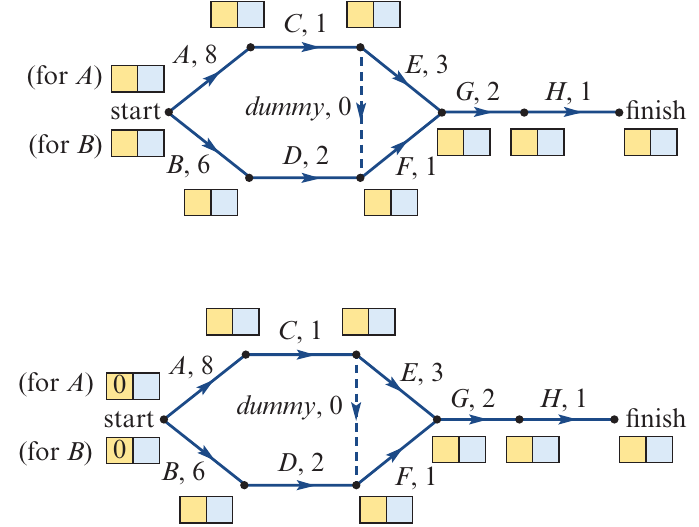
If more than one activity begins at the same vertex, draw a box for each activity and label them.
Step 2: Activities starting at the beginning of the project have an EST of 0
Write 0 in the left cell (shown in yellow) for activities that start the project:
Step 3: Calculate the EST for each activity using this formula:
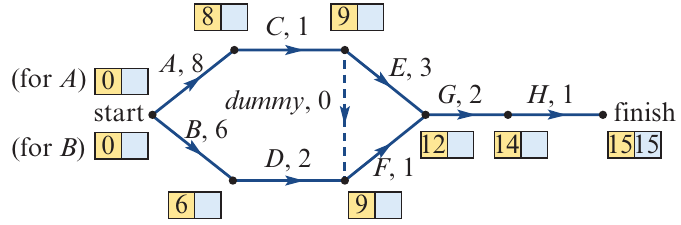
For example:
- EST of C = EST of A + duration of A =
- EST of D = EST of B + duration of B =
- EST of E = EST of C + duration of C =
Step 4 - Critical Rule for Multiple Predecessors:
If an activity has more than one predecessor, calculate EST using each predecessor and choose the LARGEST value.
This is because the activity cannot start until ALL predecessors are complete.
For example:
- EST of F using activity D:
- EST of F using dummy:
- Use 9 (the larger value)
Step 5: The EST value at the finish vertex is the minimum time to complete the project
In this example, the minimum completion time is 15 days.
Latest starting time (LST)
The latest starting time (LST) for an activity is the latest time after the start of the project that the activity can begin without delaying the whole project.
Backward scanning
Backward scanning is the reverse of forward scanning. It calculates LST values by working backwards from the finish.
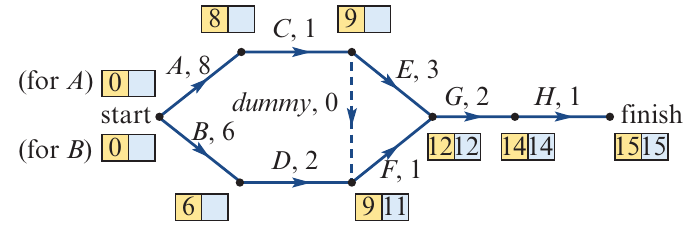
Step 1: Copy the minimum completion time into the right cell (shown in blue) at the finish vertex
Step 2: Calculate the LST for each activity using this formula:
For example:
- LST of H = LST of finish - duration of H =
- LST of G = LST of H - duration of G =
- LST of F = LST of G - duration of F =
- LST of E = LST of G - duration of E =
Step 3 - Critical Rule for Multiple Following Activities:
If more than one activity has the same predecessor, calculate LST using each following activity and choose the SMALLEST value.
This is because the activity must not delay ANY of the following activities.
For example:
- LST of E using G:
- LST of E using dummy:
- Use 9 (the smaller value)
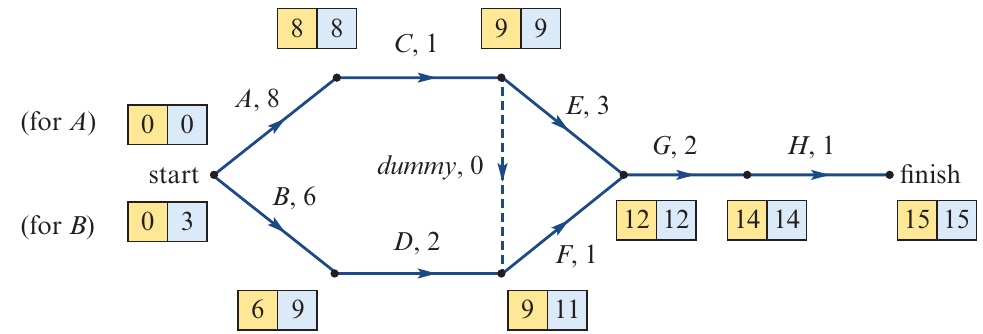
Here's the completed network with both EST and LST values:
Critical path analysis
Float times and critical activities
Once you have calculated both EST and LST for each activity, you can determine the float time:
Example 1: Activity D with Float Time
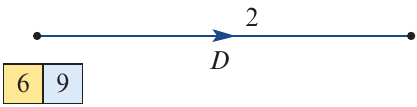
- EST for D = 6
- LST for D = 9
- Float = hours
Conclusion: Activity D can be delayed by 3 hours without delaying the project.
Example 2: Activity C with Zero Float
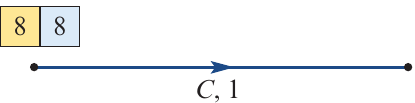
- EST for C = 8
- LST for C = 8
- Float = hours
Conclusion: Activity C has no float time - any delay to this activity will delay the entire project.
Identifying the critical path
Activities with zero float time are critical activities. Following the path of all critical activities through the network gives us the critical path:
The critical path is shown in red.
Critical path properties
A critical path:
- Is the longest (or equal longest) path through the activity network
- Contains only activities with zero float time
- Shows the sequence of activities that cannot be delayed without affecting the project completion time
- There can be more than one critical path in a network
Summary of critical path analysis
Follow these steps to complete a critical path analysis:
Forward scanning (EST):
- Draw a two-cell box at each vertex where activities begin
- Set EST = 0 for activities starting the project
- Calculate EST using: EST = EST of predecessor + duration of predecessor
- If multiple predecessors, use the LARGEST EST value
- The EST at the finish vertex = minimum project completion time
Backward scanning (LST):
- Copy the minimum completion time to the finish vertex (right cell)
- Calculate LST using: LST = LST of following activity - duration of activity
- If multiple following activities, use the SMALLEST LST value
Finding the critical path:
- Calculate float for each activity: Float = LST - EST
- Activities with float = 0 are on the critical path
- Trace the path of critical activities from start to finish
Worked examples
Worked Example 10: Finding the Critical Path from a Precedence Table
A project has six activities as shown in this precedence table:
Part a: Complete the critical path analysis to calculate EST and LST for each activity
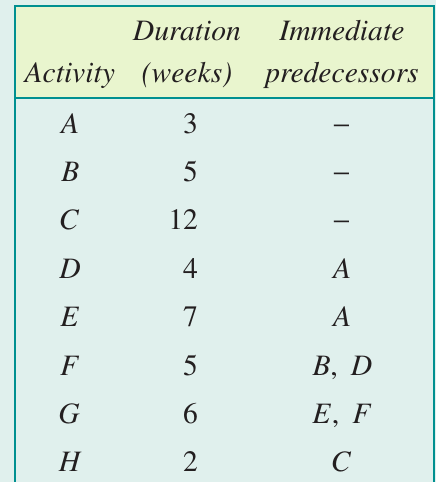
Solution:
Working:
Forward scanning:
- A: EST = 0
- B: EST = 0
- C: EST = max(0+6, 0+9) = 9
- D: EST = max(0+6, 0+9) = 9
- E: EST = 9 + 7 = 16
- F: EST = max(9+8, 16+10) = 26
Backward scanning:
- F: LST = 38
- E: LST = 38 - 12 = 26
- D: LST = 26 - 10 = 16
- C: LST = 38 - 12 = 26
- A: LST = min(16-7, 26-8) = 9
- B: LST = min(16-7, 26-8) = 9
Part b: Write down the critical path
Solution: The critical path is B → D → E → F (shown in red on the diagram)
Note: The dummy activity is not included when writing the critical path.
Part c: What is the minimum time required to complete the project?
Solution: The minimum completion time is 38 days.
Worked Example 11: Finding the Critical Path
A project has eight activities as shown in the precedence table:
Part a: Draw an activity network for this project
Solution:
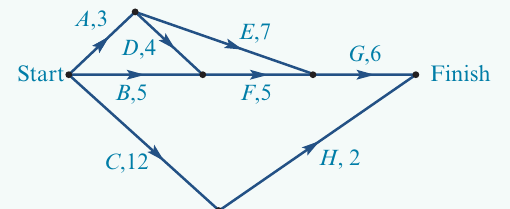
Activities A, B and C have no predecessors, so they all start at the beginning. The network continues following the precedence relationships shown in the table.
Part b: Complete the critical path analysis
Solution:
First, draw boxes at each vertex:
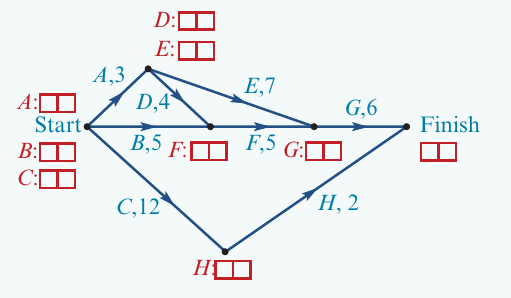
Then use forward scanning to find EST values:
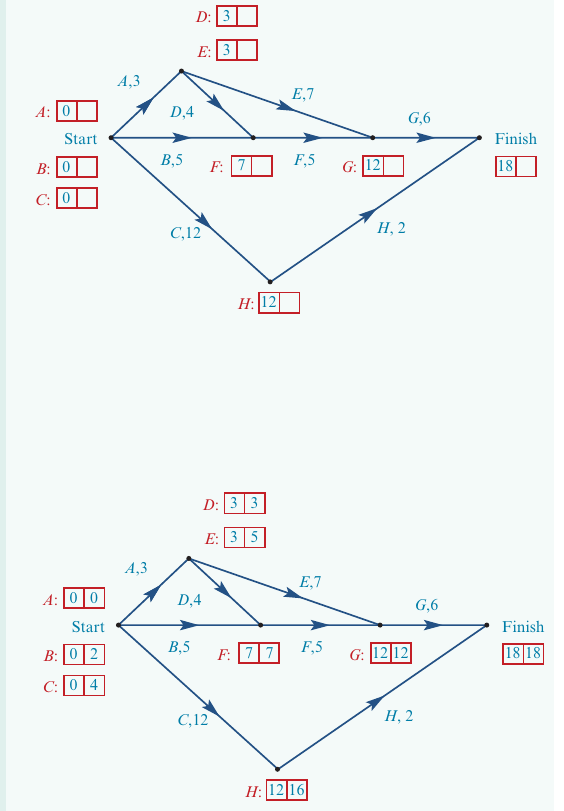
Finally, use backward scanning to find LST values. The completed network shows all EST and LST values.
Part c: What is the earliest starting time for activity H?
Solution: The EST for activity H is 12 weeks.
Part d: What is the latest starting time for activity H?
Solution: The LST for activity H is 16 weeks.
Part e: What is the float time of activity H?
Solution:
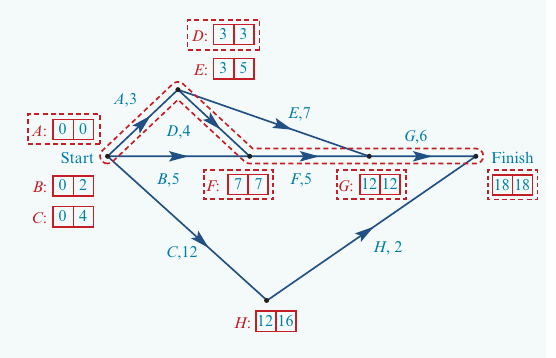
Part f: Write down the critical path
Solution: The critical path is A → D → F → G (shown by activities with EST = LST).
Part g: What is the minimum time required to complete the project?
Solution: The minimum completion time is 18 weeks.
Part h: The person responsible for activity E falls sick 3 weeks into the project and will be away for 2 weeks. Will this delay the project?
Solution:
Looking at activity E:
- EST for E = 3
- LST for E = 5
- Float for E = weeks
The person will be away for 2 weeks starting at week 3. This equals the float time for activity E. Therefore, delaying the start of activity E until the person returns will not affect the overall completion time of the project.
Key Points to Remember:
- Scheduling allocates time to project activities to determine the minimum completion time
- Float time = LST - EST and shows how much an activity can be delayed without affecting the project
- Dummy activities always have a duration of zero
- Forward scanning calculates EST: EST = EST of predecessor + duration of predecessor (use LARGEST if multiple predecessors)
- Backward scanning calculates LST: LST = LST of following activity - duration of activity (use SMALLEST if multiple following activities)
- Critical activities have zero float time (EST = LST)
- The critical path connects all critical activities and represents the longest path through the network - any delay to these activities will delay the entire project