Measures of Centre (VCE SSCE General Mathematics): Revision Notes
Measures of Centre
Introduction to summary statistics
When working with data, we often need to summarise large amounts of information into just a few key numbers. A statistic is any number we calculate from data. Some statistics are particularly useful because they help us understand the most important features of a dataset - these are called summary statistics.
While summarising data into one or two numbers means we lose some detail, a well-chosen summary statistic can reveal important patterns that might be hidden in a long list of values. In this topic, we focus on measures of centre, which tell us where the "middle" or "typical" value of our data lies.
The power of summary statistics lies in their ability to transform large, complex datasets into meaningful insights. While we sacrifice some detail, we gain clarity about the overall patterns in our data.
The mean
The mean is the most commonly used measure of the centre of a distribution. You probably know it as the "average". We calculate the mean by adding up all the data values and then dividing by how many values we have.
Formula for the mean
Example calculation
Consider this simple dataset:
Statistical notation
As formulas become more complex in statistics, we use special notation to write them more compactly:
- (Greek capital letter sigma) means "sum of"
- represents a data value
- (pronounced "x bar") represents the mean
- represents the total number of data values
Using this notation, we write the formula for the mean as:
This compact notation makes complex statistical formulas much easier to write and understand. You'll see this notation throughout your study of statistics, so it's worth becoming familiar with these symbols early.
Worked Example: Calculating the Mean
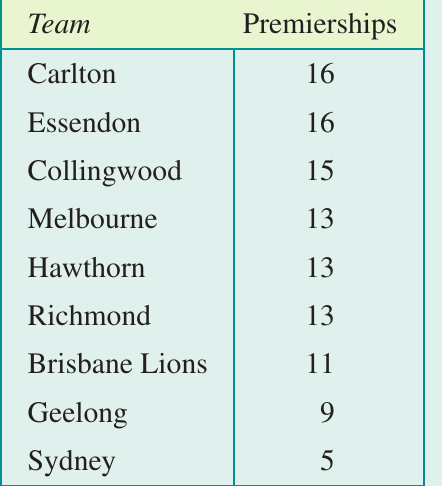
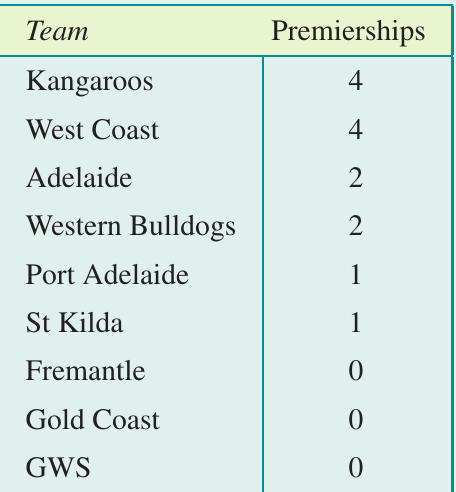
Let's calculate the mean number of AFL premierships won by the current teams (data up to 2021).
Step 1: Write down the formula and identify
We have teams.
Step 2: Substitute into the formula
Step 3: Calculate and round to one decimal place
The mean number of premierships won is (to one decimal place).

The median
The median is another useful measure of the centre of a distribution. The median is the middle value when all observations are arranged in order from smallest to largest.
Finding the median when there is an odd number of values
When we have an odd number of data values, the median is simply the middle value. For example, in this ordered dataset:
The median is because there are five observations on either side of it.
Finding the median when there is an even number of values
When we have an even number of data values, there is no single middle value. In this case, the median is the midpoint (average) of the two middle values. For example:
The median is halfway between and :
Rules for Determining the Median
To find the median:
-
Arrange all observations in ascending order (from smallest to largest)
-
If is odd: the median is the th observation
-
If is even: the median is the average of the th and th observations
Remember: Always order your data first - this is the most commonly forgotten step!
Example: median from the AFL premierships data
Returning to our AFL premierships data, since the values are already in order and we have teams (an even number), we need to find the ninth and tenth values.
From the tables, the ninth value is and the tenth value is .
This tells us that half the AFL teams have won the premiership or more times, and half have won or fewer times.
Worked Example: Median When is Odd
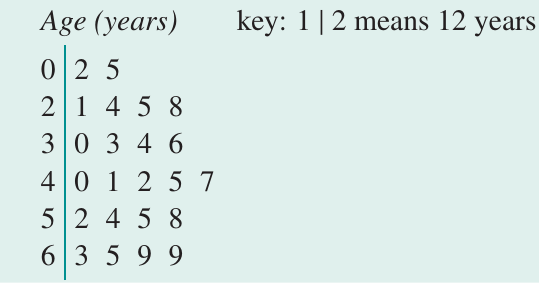
Step 1: Determine the number of observations
Step 2: Since is odd, find the position of the median
The median is at the 12th position.
Step 3: Count through the ordered data to find the 12th value
Counting through the stem plot:
The median age is years.
Worked Example: Median When is Even
Find the median age for a group of people whose ages are displayed in this ordered stem plot:
| Age (years) | Values |
|---|---|
| 0 | 5 9 |
| 2 | 1 3 5 8 |
| 3 | 0 0 4 9 9 |
| 4 | 0 4 5 8 |
| 5 | 3 7 |
| 6 | 3 |
Key: represents years
Step 1: Determine the number of observations
Step 2: Since is even, find the positions of the two middle values
Step 3: Find the values at the 9th and 10th positions
The 9th value is and the 10th value is .
Step 4: Calculate the median
The median age is years.
Finding the median from a dot plot
We can also find the median from a dot plot by counting the dots to locate the middle value(s).
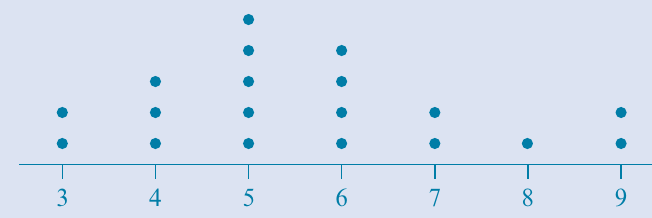
For this dot plot with values (even number), we need the 6th and 7th values. Both are , so the median is .
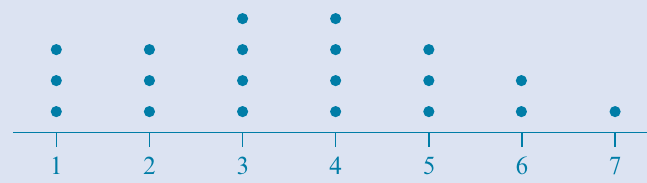
For this dot plot with values (even number), we need the 9th and 10th values. The median would be calculated by finding these middle values and averaging them.
When working with dot plots, it's helpful to count systematically from left to right to avoid missing any values. You can also count from both ends simultaneously to find the middle position more quickly.
Comparing the mean and median
In our AFL premierships example, we found:
- Mean = premierships
- Median = premierships
These values are quite different. Why is this, and which measure is better?
Understanding the difference through distribution shape
Looking at a stem plot of the premierships data:
| Premierships won | Values |
|---|---|
| 0 | 0 0 0 1 1 2 2 4 4 |
| 0 | 5 9 |
| 1 | 1 3 3 3 |
| 1 | 5 6 6 |
We can see the distribution is positively skewed (stretched out towards the higher values). This reveals an important property of the mean: it is "pulled" towards extreme values or the tail of the distribution.
In a positively skewed distribution, the mean is typically greater than the median because it's influenced by the few very high values. This is why understanding the shape of your distribution is crucial before choosing a measure of centre.
When to use the median
Use the Median When:
The median is the preferred measure of centre when:
- The distribution is skewed (positively or negatively)
- There are outliers (extremely large or small values compared to the rest)
- You need the true middle value that divides the data in half
The median is not affected by extreme values, so it always gives us the genuine middle of the data.
When to use the mean
Use the Mean When:
The mean is the preferred measure of centre when:
- The distribution is symmetric (balanced on both sides)
- There are no outliers
- You want the most familiar measure that most people understand
When the distribution is symmetric with no outliers, either measure is appropriate, but we often prefer the mean because it's easier to calculate and more familiar.
Exam Tip
Always look at the shape of the distribution before choosing a measure of centre. If you see a skewed distribution or notice some very extreme values, the median will give you a better representation of the "typical" value than the mean.
Key Points to Remember:
-
The mean is calculated by summing all values and dividing by the number of values:
-
The median is the middle value when data is arranged in order. For odd , it's the th value; for even , it's the average of the th and th values.
-
Use the median when data is skewed or contains outliers, as it's not affected by extreme values.
-
Use the mean when data is symmetric with no outliers, as it's more familiar and easier to work with.
-
Always arrange data in order before finding the median - this is a crucial step that's easy to forget!