Measures of Centre and Spread (VCE SSCE General Mathematics): Revision Notes
Measures of Centre and Spread
Introduction
When describing a data distribution numerically, we use two types of measures:
- Measures of centre: tell us about the typical or central value
- Measures of spread: tell us how spread out the data values are
The most versatile statistical tools are:
- The median as a measure of centre
- The range and interquartile range (IQR) as measures of spread
These measures can be determined exactly from dot plots and stem plots, but only estimated approximately from histograms.
The median
Definition
The median is the middle value in an ordered data set.
For data values, the median is located at the th position.
When:
- is odd, the median will be the middle data value
- is even, the median will be the average of the two middle data values
Finding the median from a data set
Worked Example: Finding the Median
Given data set:
Step 1: Write the data in order from smallest to largest
Ordered:
Step 2: Locate the middle value(s)
There are values, so the median is at position
Step 3: Identify the median
Median
Check: Count the values on each side - there should be values below and values above the median. ✓
General steps:
- Write the data in order from smallest to largest
- Locate the middle value(s)
- If odd number of values: median is the middle value
- If even number of values: median is the average of the two middle values
Finding the median from a dot plot
A dot plot already displays data in order, making it easy to locate the median by counting.
Worked Example: Median from a Dot Plot
For cricket team members, the median age is the th value from either end.
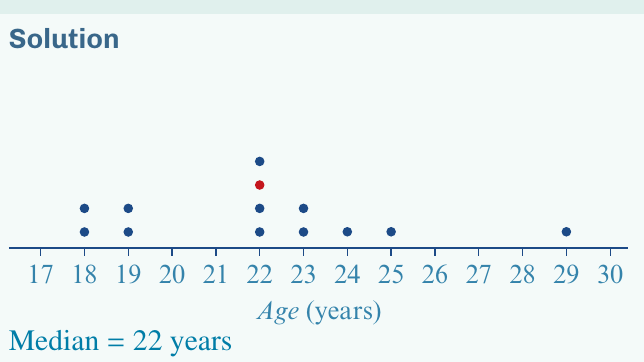
Median age years
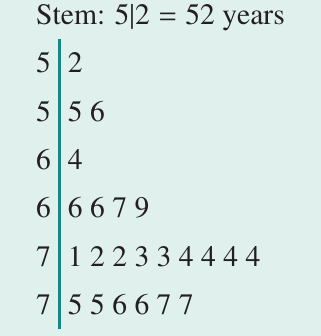
Finding the median from a stem plot
Stem plots also display ordered data. Count from either end to find the middle position.
Worked Example: Median from a Stem Plot (Even Number of Values)
For the temperature data with values:
| Stem | Leaf |
|---|---|
| 1 | 8 9 9 |
| 2 | 0 2 5 7 8 9 9 |
| 3 | 1 3 |
Key:
The median is the average of the th and th values:
The range
Definition
The range, , is the simplest measure of spread. It shows the total spread of the data.
Finding the range from a stem plot
Worked Example: Finding the Range
Using the same temperature data:
Lowest value , Highest value
Range
Limitations of the range
Important Limitations of the Range:
The range has important limitations that make it less useful than other measures:
- It depends only on the two extreme values
- It can be heavily affected by outliers
- Data sets with the same highest and lowest values have the same range, regardless of how the middle values are distributed
For these reasons, the interquartile range is often a better measure of spread.
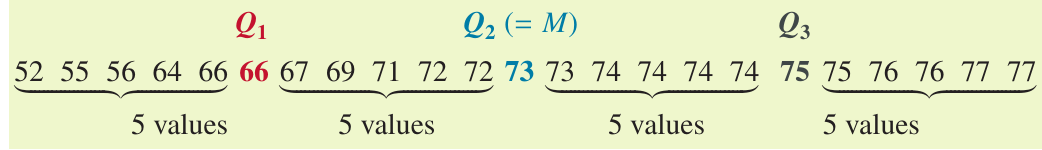
The interquartile range (IQR)
Understanding quartiles
Quartiles divide a distribution into quarters (four equal parts).
- (first quartile): the value with 25% of data below it and above it
- (second quartile): the median, with 50% of data on each side
- (third quartile): the value with 75% of data below it and above it
Determining the interquartile range
Steps:
- Arrange all observations in order
- Divide the observations into two equal-sized groups
- If is odd, omit the median from both groups
- Find median of the lower half
- Find median of the upper half
- Calculate:
Interpretation: The IQR gives the spread of the middle 50% of data values.
Finding IQR when is even
Worked Example: IQR When is Even
Given: Weights of cats (in kg)
| Stem | Leaf |
|---|---|
| 1 | 9 |
| 2 | 1 3 5 8 |
| 3 | 0 0 4 9 9 |
| 4 | 0 4 5 8 |
| 5 | 0 3 |
| 6 | 3 4 |
Key: kg
Step 1: With values, there are values in each half.
Step 2: Find (median of lower half)
Lower half:
kg (the th value from bottom)
Step 3: Find (median of upper half)
Upper half:
kg (the th value from top)
Step 4: Calculate IQR
Finding IQR when is odd
Worked Example: IQR When is Odd
Given: Life expectancy for countries
Step 1: Find the median
With values, the median is the th value years.
Step 2: Exclude the median (since is odd)
This leaves values below and values above.
Step 3: Find quartiles
(middle of bottom values)
(middle of top values)
Step 4: Calculate IQR
Check: The quartiles should divide the data into four equal groups of values each (with the median excluded). ✓
Finding median and quartiles from a histogram
For grouped data shown in a histogram, we can only find the interval containing each quartile, not exact values.
Worked Example: Quartiles from a Histogram
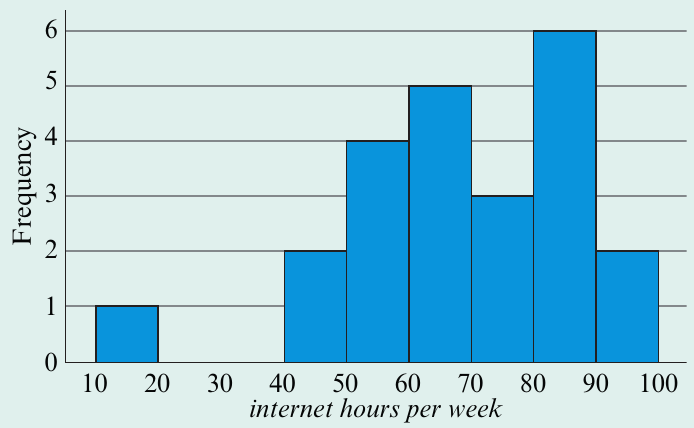
For people's internet usage:
- Median (th value): in interval 60-70 hours
- (th value): in interval 50-60 hours
- (th value from top): in interval 80-90 hours
Why is IQR more useful than the range?
Advantages of IQR over Range:
The IQR is superior to the range because:
- It measures the spread of the middle 50% of data
- The upper and lower are excluded
- It is not affected by outliers
- It provides a more stable measure of spread
The mean and standard deviation
The mean and standard deviation are alternative measures of centre and spread. They are most useful for symmetric distributions without outliers.
While more restrictive than median and IQR, these measures can fully describe a symmetric distribution with just two numbers.
The mean
The mean is what most people call the 'average'. It is the balance point of a distribution.
Worked Example: Calculating the Mean
For the data set :
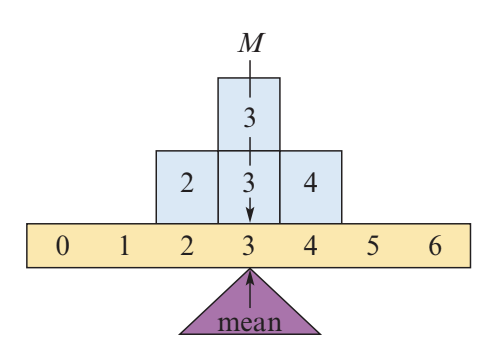
The mean represents the balance point. In symmetric distributions, the mean and median are equal.
Effect of outliers on the mean
Worked Example: How Outliers Affect the Mean
For the data set :
Median remains , but:
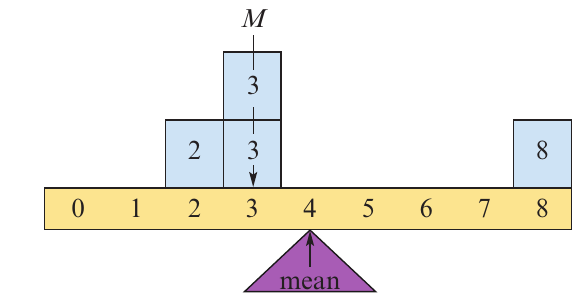
The mean is pulled toward the outlier (), while the median stays at . This shows that the mean is affected by extreme values but the median is not.
Statistical notation
To write formulas more compactly, we use:
- (Greek capital sigma): means "sum of"
- : represents a data value
- (pronounced "x bar"): represents the mean
- : represents the total number of data values
The formula for the mean becomes:
Worked Example: Using Statistical Notation
Given: Reaction times (in milliseconds):
Step 1: Count the values
(number of values)
Step 2: Sum the values
Step 3: Calculate the mean
Relationship between mean and median
For symmetric distributions:
- The median lies at the midpoint
- The mean is the balance point
- Mean Median (approximately equal)
Worked Example: Symmetric Distribution
Mortality rates for US cities
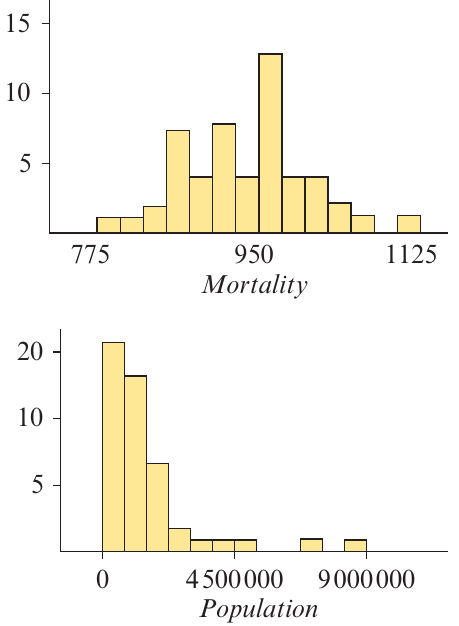
Mean per
Median per
Very similar values, as expected for a symmetric distribution.
For skewed distributions:
- Mean and median are different
- The mean is pulled toward the tail
- The mean may not represent a typical value
Worked Example: Skewed Distribution
Population distribution (positively skewed)
Mean population million
Median population million
The mean has been affected by extreme values in the tail.
When to use median rather than mean
The median is a resistant statistic - it is relatively unaffected by extreme values.
Use the median when:
- The distribution is clearly skewed
- There are outliers present
- You want a measure that represents a typical value
Example: Median house prices are used in Australia because house price distributions are positively skewed (a few very expensive houses).
Use the mean when:
- The distribution is symmetric
- There are no outliers
- You need to do further statistical calculations
Choosing between mean and median
Decision Rule:
If the distribution is:
- Symmetric with no outliers: Either mean or median can be used
- Clearly skewed and/or has outliers: Use the median
The standard deviation
To measure spread around the median, we use the IQR.
To measure spread around the mean, we use the standard deviation ().
Definition
The formula for the standard deviation is:
The standard deviation is an average of the squared deviations from the mean. We square the deviations because the sum of deviations around the mean (the balance point) always equals zero.
Calculating standard deviation using a calculator
You will normally use a CAS calculator to find the standard deviation.
Worked Example: Standard Deviation Using TI-Nspire CAS
Given: Heights (in cm) of women:
Using TI-Nspire CAS:
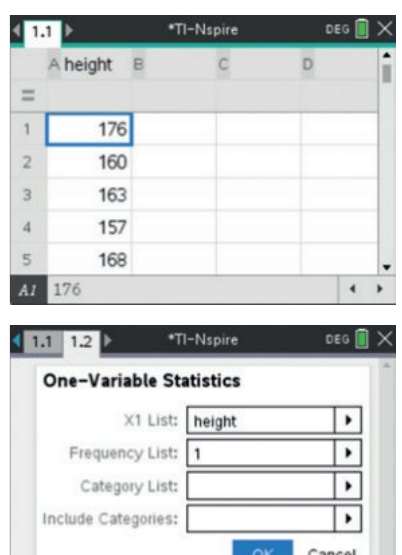
Step 1: Enter data into a list (e.g., named "height")
Step 2: Go to Statistics > Stat Calculations > One-Variable Statistics
Step 3: Select the list name as X1 List
Step 4: Press enter to generate results
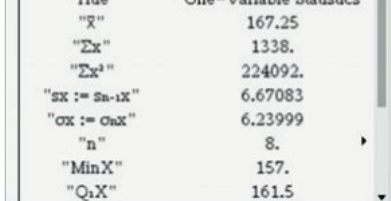
Results show:
- (sample standard deviation)
- Minimum
Answer: Mean height cm, Standard deviation cm
The sample standard deviation is denoted on the calculator.
Summary: choosing the right measures
| Distribution type | Measure of centre | Measure of spread |
|---|---|---|
| Symmetric, no outliers | Mean () or Median | Standard deviation () or IQR |
| Skewed or has outliers | Median | IQR |
Key principle: Use median and IQR together, or use mean and standard deviation together. Don't mix them inappropriately.
Remember!
Key Points to Remember:
- The median is the middle value that divides data in half - it is resistant to outliers
- The range () is the simplest measure of spread but is affected by extreme values
- The IQR measures the spread of the middle of data and is not affected by outliers
- The mean () is the balance point of a distribution and can be affected by outliers
- The standard deviation () measures spread around the mean and is best used with symmetric distributions
- For symmetric distributions with no outliers, use mean and standard deviation
- For skewed distributions or data with outliers, use median and IQR
- Always check your quartiles by ensuring they divide the data into four equal groups