Measures of Spread (VCE SSCE General Mathematics): Revision Notes
Measures of Spread
Understanding variability in data
When analysing data, we need to understand how spread out the values are. Are the observations clustered closely together, or do they vary widely? A measure of spread (also called a measure of variability) helps us quantify this characteristic of a data set.
Three main measures of spread are used in statistics:
- The range
- The interquartile range
- The standard deviation
Each measure has different strengths and is suited to different situations.
The range
What is the range?
The range is the simplest way to measure how spread out data is. It tells us the distance between the smallest and largest values in a data set.
The range () is defined as:
The range is easy to calculate but has limitations because it only uses two values from the entire data set.
Worked example: calculating the range
Worked Example: Finding the Range
Consider the marks awarded to a group of students for two different tasks:
Task A:
Task B:
Let's find the range for each distribution.
Solution for Task A:
The minimum mark is and the maximum mark is
Solution for Task B:
The minimum mark is and the maximum mark is
Interpreting the range from stem-and-leaf plots
Stem-and-leaf plots (also called stem plots) provide a useful way to visualise data distributions and identify minimum and maximum values.
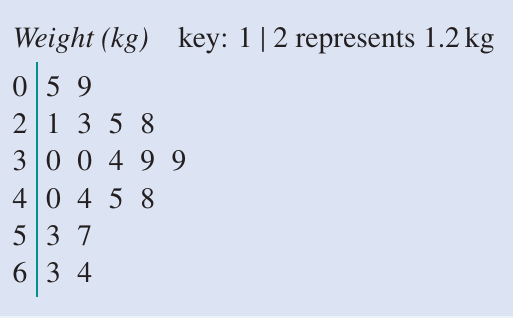
For the cat weights shown in the stem plot above, we can see:
Minimum value: kg (from stem , leaf )
Maximum value: kg (from stem , leaf )
Therefore: kg
Limitations of the range
A Critical Weakness of the Range
While the range is simple to calculate, it has a significant weakness: it can be heavily influenced by extreme values (outliers).
Let's compare the stem plots for Task A and Task B:
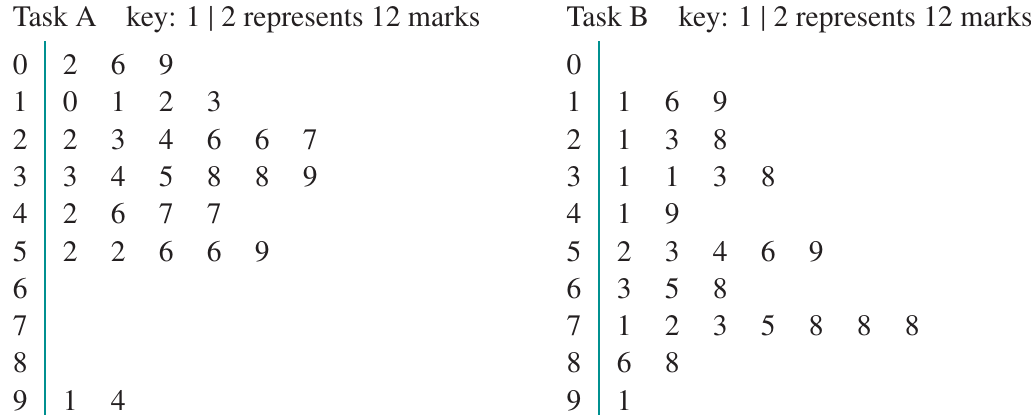
Even though Task A has a larger range than Task B ( compared to ), looking at the stem plots reveals that Task A's marks are actually more concentrated than Task B's marks. The large range for Task A is caused by just two unusual values ( and ).
Most of Task A's marks are clustered between and , whilst Task B's marks are more evenly spread across the range from to . This demonstrates that the range alone doesn't always give us an accurate picture of how spread out data truly is.
This limitation leads us to consider alternative measures of spread that are not so affected by extreme values.
The interquartile range
What is the interquartile range?
The interquartile range (IQR) is a more robust measure of spread than the range. It focuses on the middle portion of the data and is not affected by extreme values or outliers.
The IQR measures the spread of the middle 50% of observations by using quartiles to divide the data.
Understanding quartiles
How Quartiles Work
Quartiles split an ordered data set into four equal parts:
-
(first quartile): The median of the lower half of the data. This value has 25% of observations below it and above it.
-
(second quartile): This is simply the median of the entire data set, with of observations below and above. We don't commonly use the notation .
-
(third quartile): The median of the upper half of the data. This value has 75% of observations below it and above it.
How to calculate the IQR
To find the interquartile range:
- Arrange all observations in ascending order
- Divide the observations into two equal-sized groups (if is odd, omit the median from both groups)
- Find by calculating the median of the lower half
- Find by calculating the median of the upper half
- Calculate:
The IQR represents the range covered by the middle of the data values.
Worked example: finding the interquartile range
Worked Example: Calculating the IQR
Let's find the IQR for Task A and Task B from our earlier example, and compare the results.
Task A (30 values total):
Since there are values, we have values in each half.
Lower half:
The median of the lower half () is the th value:
Upper half:
The median of the upper half () is the th value:
Calculate IQR:
Task B (30 values total):
Following the same process:
Comparison:
The IQR shows that the variability of Task A marks () is smaller than the variability of Task B marks (). This makes sense when we look at the stem plots - most Task A marks are concentrated in a narrower range than Task B marks.
Finding IQR from a stem plot
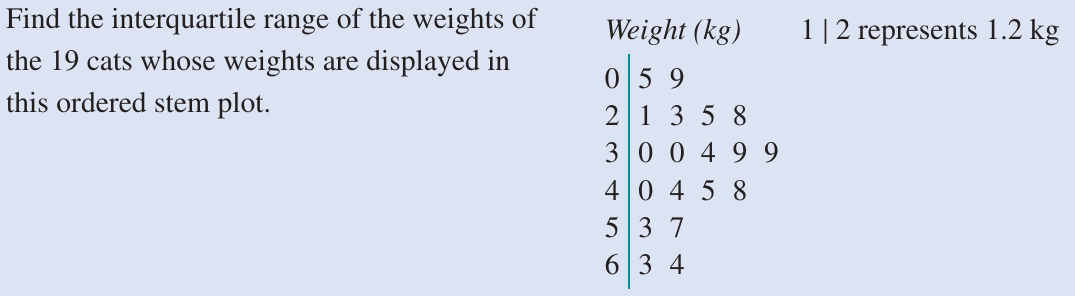
For the cat weights data shown above with values:
- Find the median (the th value in the ordered list)
- Since we have an odd number of values, omit the median
- This leaves values in each half
- Find (the median of the lower values)
- Find (the median of the upper values)
- Calculate:
Advantages of the IQR
Why the IQR is Superior to the Range
The interquartile range has several important advantages:
- It describes the spread of the middle 50% of observations
- It measures variability around the median
- It is not affected by outliers or extreme values, since the upper and lower of observations are excluded from the calculation
- It is a reliable measure of spread for any distribution, whether skewed or symmetric
This makes the IQR particularly useful when comparing data sets that may contain unusual values.
The standard deviation
What is standard deviation?
The standard deviation () is the most commonly used measure of spread in statistics. Unlike the IQR which measures spread around the median, standard deviation measures the spread of data around the mean ().
Standard deviation tells us the typical distance that data values sit from the mean. A small standard deviation indicates that values are clustered close to the mean, whilst a large standard deviation indicates that values are more spread out.
The formula for standard deviation
The Standard Deviation Formula
The standard deviation is defined as:
where:
- is the number of data values (sample size)
- is the mean
- represents each individual data value
- represents the deviation of each value from the mean
Understanding the formula
The standard deviation formula calculates an average of the squared deviations from the mean. Let's break down why this approach is used:
- We find how far each value is from the mean:
- We square these deviations:
- We sum all the squared deviations:
- We divide by to find an average
- We take the square root to get back to the original units
Why Square the Deviations?
If we simply added up all the deviations , they would always sum to zero (positive and negative deviations cancel out). Squaring makes all deviations positive so we can meaningfully add them.
Why Divide by Instead of ?
This is for theoretical statistical reasons. Using gives us the sample standard deviation, which is the version we use in this course.
Worked example: calculating standard deviation by hand
Worked Example: Manual Calculation of Standard Deviation
Let's calculate the standard deviation for the data set:
Step 1: Create a table to organise the calculations
We need columns for:
- (the data values)
- (deviations from the mean)
- (squared deviations)
Step 2: Calculate the mean
Step 3: Complete the table
| Sum |
Notice that the sum of the deviations is zero, which confirms our calculations are correct.
Step 4: Substitute into the formula
Therefore, the standard deviation is .
Calculating standard deviation in practice
Whilst it's important to understand how standard deviation is calculated, in practice you will use a CAS calculator to find this value. Manual calculation is only required for the simplest data sets.
Using technology to find measures of spread
Modern technology makes calculating summary statistics much faster and more accurate than manual calculation. Both the TI-Nspire CAS and ClassPad calculators can compute all measures of spread instantly.
Example: monthly rainfall data
Worked Example: Using Technology for Summary Statistics
The following table shows monthly rainfall figures for Melbourne over one year:
| Month | J | F | M | A | M | J | J | A | S | O | N | D |
|---|---|---|---|---|---|---|---|---|---|---|---|---|
| Rainfall (mm) | 48 | 57 | 52 | 57 | 58 | 49 | 49 | 50 | 59 | 67 | 60 | 59 |
Let's use technology to find the mean, standard deviation, median, interquartile range, and range for this data.
Using the TI-Nspire CAS calculator
Steps:
- Start a new document and add a Lists & Spreadsheet application
- Enter the rainfall data into a list (name it 'rain')
- Add a Calculator application
- Select: Statistics → Stat Calculations → One-Variable Statistics
- Press enter and select OK to generate the results
Calculator output:
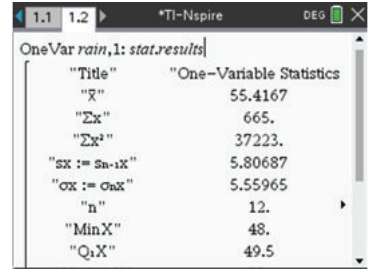
The calculator displays all summary statistics including:
- Mean:
- Sample standard deviation:
- Median:
- First quartile:
- Third quartile:
- Minimum:
- Maximum:
Final answers (rounded to one decimal place):
Mean: mm
Standard deviation: mm
Median: mm
Interquartile range: mm
Range: mm
Using the ClassPad calculator
The ClassPad follows a similar process:
- Open the Statistics application
- Enter data into a column
- Select Calc → One-Variable from the menu
- Complete the dialog box to specify the data list
- Tap OK to view results
The ClassPad displays the same summary statistics, using for the sample standard deviation.
Both calculators allow you to scroll through the results to see additional statistics if needed.
Choosing the right measure of spread
Different measures of spread are appropriate for different situations:
Use the range when:
- You need a quick, simple measure
- You want to know the total span of the data
- The data has no extreme outliers
Use the IQR when:
- The data contains outliers or extreme values
- The distribution is skewed
- You want a robust measure not affected by extremes
- You're using the median as the measure of centre
Use the standard deviation when:
- The distribution is roughly symmetric
- You want to measure spread around the mean
- You need the most commonly used measure for further statistical analysis
- You're using the mean as the measure of centre
Key Points to Remember:
-
The range is the simplest measure of spread: , but it's affected by outliers.
-
The interquartile range measures the spread of the middle of data: . It's robust and not affected by extreme values.
-
Quartiles divide ordered data into quarters: has below it, has below it.
-
The standard deviation measures typical distance from the mean: . It uses squared deviations because regular deviations sum to zero.
-
Use a CAS calculator to calculate measures of spread efficiently and accurately. Both TI-Nspire and ClassPad can compute all summary statistics from data lists.
-
Choose your measure of spread based on the data distribution and whether it contains outliers. IQR is best for skewed data, whilst standard deviation works well for symmetric distributions.