Types of Data (VCE SSCE General Mathematics): Revision Notes
Types of Data
Understanding different types of data is fundamental to statistics. When you collect information through surveys or experiments, the nature of that information determines how you can analyse and interpret it. Let's explore the main categories of data and how to classify them correctly.
Variables and data
When we conduct surveys or experiments, we collect information that varies between individuals or observations. Each characteristic we measure is called a variable. For example, if you survey students about their height, weight, age, and study preferences, each of these characteristics is a separate variable.
The actual values we collect for these variables are called data. For instance, if one student is cm tall, weighs kg, and is years old, these specific numbers are the data points.
The distinction between variables and data is crucial: variables are the characteristics you're measuring, while data are the specific values you record. Think of variables as the questions you ask and data as the answers you receive.
Here's an example dataset from a student survey:
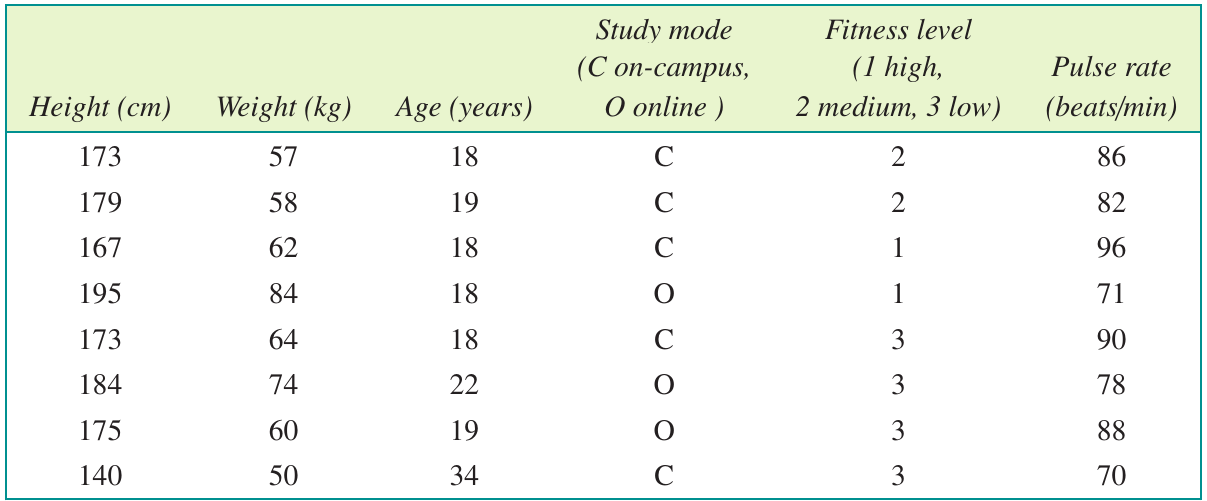
This table shows six different variables (height, weight, age, study mode, fitness level, and pulse rate) collected from eight students. Notice how each variable produces different types of information.
Types of variables
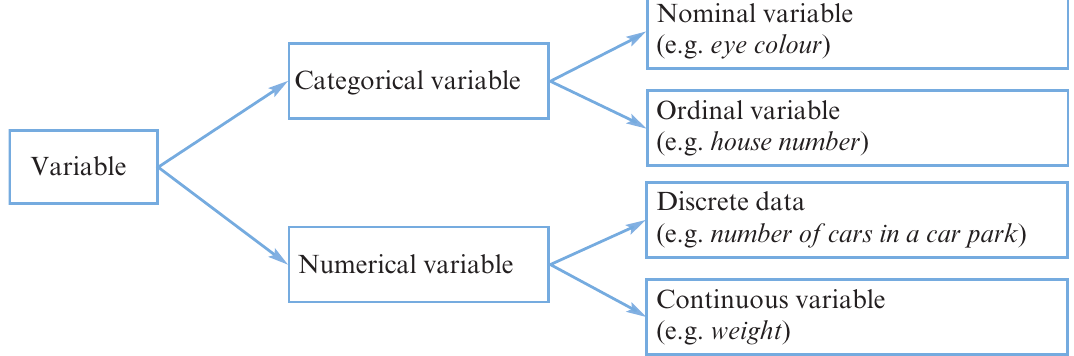
All variables can be classified into two main categories: categorical and numerical. Understanding which type you're working with is crucial because it determines what kind of analysis you can perform.
Why Classification Matters
Correctly identifying the type of variable is essential for choosing the right statistical methods. Using the wrong analytical approach can lead to meaningless results or incorrect conclusions. Always classify your variables before beginning any analysis.
Categorical variables
Categorical variables describe qualities or attributes rather than quantities. They sort individuals into different groups or categories. For example, a person's eye colour, their preferred study mode, or their fitness level are all categorical variables.
When you collect data from a categorical variable, you're essentially labelling each individual with a category name. In our student survey example, Study mode is categorical because it places students into either the "on-campus" or "online" group.
Categorical variables come in two distinct types:
Nominal variables
Nominal variables simply name or label categories without any inherent order. The word "nominal" comes from the Latin word for "name," which helps you remember its meaning.
Think of study mode (on-campus versus online) as an example. There's no logical way to say one category comes "before" or "after" the other—they're just different options with no ranking. Other examples include eye colour, favourite sport, or country of birth.
When working with nominal data, you can count how many individuals fall into each category, but you cannot arrange the categories in a meaningful order. The categories are simply labels with no inherent ranking.
Ordinal variables
Ordinal variables go one step further than nominal variables. Not only do they name categories, but they also allow you to arrange those categories in a logical order. The word "ordinal" relates to "order," which is your clue to its meaning.
Consider the fitness level variable in our survey, which uses the scale: = high, = medium, = low. These numbers don't represent actual measurements; instead, they rank students' fitness levels from high to low. You can clearly order these categories: high fitness is better than medium, which is better than low.
Understanding Ordinal Gaps
While you can order the categories in ordinal data, the differences between them aren't necessarily equal. The gap between "high" and "medium" fitness might not be the same as the gap between "medium" and "low." This is a crucial distinction that affects how you can analyse ordinal data.
Numerical variables
Numerical variables represent quantities that arise from counting or measuring. These variables produce data that are actual numbers with mathematical meaning. For instance, a height of cm or a pulse rate of beats per minute are numerical values that tell you "how much" or "how many."
The key feature of numerical variables is that you can perform arithmetic operations on them. You can calculate averages, find differences, and compare values in meaningful ways.
Numerical variables are classified into two types:
Discrete variables
Discrete variables can only take specific, countable values. Typically, these are whole numbers like and often arise from counting situations.
When someone asks "How many?" the answer usually involves a discrete variable. For example:
- How many mobile phones are in your house?
- How many students are in your class?
- How many goals were scored in a football match?
You cannot have mobile phones or students—discrete variables only take distinct, separate values. Even if you count a very large number of items, each count is a specific whole number.
The Counting Connection
Discrete variables are almost always the result of counting rather than measuring. If you're counting items, events, or occurrences, you're working with discrete data. This is a helpful rule of thumb when classifying variables.
Continuous variables
Continuous variables can take any value within a range and are associated with measuring rather than counting. Theoretically, continuous variables have infinite possible values, even though our measuring instruments limit how precisely we can record them.
When someone asks "How much?" the answer typically involves a continuous variable. For example:
- How much does a person weigh?
- How much time did it take to complete a task?
- How much rainfall was recorded?
Consider height: even though we might record someone's height as cm, their actual height could be any value between cm and cm. We round to cm because that's as precise as our measuring device allows, but the true value is somewhere in that continuous range.
Precision vs. Reality
The values you record for continuous variables are limited by your measuring instrument's precision, not by the nature of the variable itself. A person's weight doesn't suddenly jump from kg to kg—it changes continuously. The discrete values you see when you measure are simply approximations of the true continuous value.
Distinguishing between numerical and categorical data
Sometimes it's not immediately obvious whether a variable is numerical or categorical. Understanding the distinction is crucial for proper analysis. Here are two helpful strategies to make the classification:
Strategy 1: Can you perform arithmetic?
Numerical data can always be used in arithmetic calculations. You can find the average height of a group or the total weight of several packages. However, categorical data cannot be used this way. It makes no sense to calculate the "average house number" on a street or the "total" of people's eye colours.
When you're unsure, ask yourself: "Would it make sense to calculate the average or total of these values?" If yes, the data is numerical. If no, it's categorical.
Strategy 2: Consider how the data is recorded
The same variable might be numerical or categorical depending on how you record it. For example:
- If you record weight in kilograms (like kg, kg, kg), it's numerical data
- If you record weight in categories (like "underweight," "normal weight," "overweight"), it's categorical data
The variable name alone doesn't determine the type—you must also consider the recording method.
Worked example: Classifying data types
Let's practice classifying different types of data. For each scenario below, determine whether the data is nominal, ordinal, discrete, or continuous.
Worked Example: Classifying Data Types
Scenario a: The number of chocolate chips in each of cookies is counted.
Answer: This is discrete data. You can only have whole numbers of chocolate chips (you can't have chocolate chips). The data arises from counting, which is a clear indicator of discrete data.
Scenario b: The time taken for students to complete a puzzle is recorded in seconds.
Answer: This is continuous data. Time can take any value—a student might complete the puzzle in seconds or seconds, depending on how precisely you measure. Even though you record it to a certain precision (like whole seconds), the actual time is a continuous measurement.
Scenario c: Football club members rate their satisfaction with the current coach using: = Very satisfied, = Satisfied, = Indifferent, = Dissatisfied, = Very dissatisfied.
Answer: This is ordinal data. The numbers don't represent quantities—they represent levels of satisfaction that can be meaningfully ordered from very satisfied to very dissatisfied. You can rank the responses, but the numerical values themselves don't have mathematical meaning (satisfaction level isn't "twice" anything compared to satisfaction level ).
Scenario d: Students choose their preferred colour from the list: = Blue, = Green, = Red, = Yellow.
Answer: This is nominal data. The numbers are simply codes for colours—they're labels, not quantities. There's no meaningful order to the colours (blue isn't "less than" green in any logical way). The numbers could be replaced with letters or any other labels.
Scenario e: Students' weights are classified as "less than kg," " kg to kg," or "more than kg."
Answer: This is ordinal data. Although weight itself is a numerical measurement, recording it in ordered categories makes it categorical. The categories can be logically ordered from lightest to heaviest, which makes the data ordinal rather than nominal.
Key Points to Remember:
-
Variables are characteristics that differ between individuals, while data are the actual values collected for those variables
-
Categorical variables classify individuals into groups:
- Nominal if just naming categories
- Ordinal if naming and ordering categories
-
Numerical variables represent quantities from counting or measuring:
- Discrete for countable values (whole numbers from counting)
- Continuous for measured values (any value within a range)
-
Use the "Can you calculate an average?" test to distinguish numerical from categorical data—if averaging makes sense, it's numerical
-
Ask "How many?" for discrete variables and "How much?" for continuous variables to help classify numerical data correctly