Using a Logarithmic (Base 10) Scale to Display Data (VCE SSCE General Mathematics): Revision Notes
Using a Logarithmic (Base 10) Scale to Display Data
Why use logarithmic scales?
When working with statistical data, we often encounter numerical variables that span several orders of magnitude. This means the values range from very small to very large numbers. For example, the populations of countries can range from a few thousand to over billion. Similarly, animal body weights might range from less than kg to tens of thousands of kilograms.
If we try to create a histogram using a normal (linear) scale for such data, we face a significant problem. Most data points cluster together at one end of the scale, whilst extreme values appear far away at the other end. This makes it impossible to see patterns in the data effectively.
A logarithmic scale (or log scale) solves this problem by spreading out the smaller values and compressing the larger values. This allows us to display all the data effectively on a single graph.
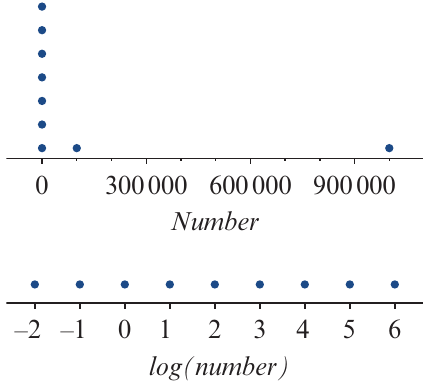
The diagram above demonstrates this principle. On the linear scale (top), most values cluster near zero, with one point far to the right. On the logarithmic scale (bottom), the same data points are evenly distributed, making the pattern much clearer.
Understanding logarithms to base 10
To use a logarithmic scale, we need to understand what logarithms are. Let's start with a simple pattern.
Consider this sequence of numbers:
Each of these numbers can be written as a power of 10:
If we understand we're only working with powers of , we can simply write the exponents:
These exponents are called the logarithms (or logs) of the original numbers.
When we express numbers as powers of , we say we're using logarithms to the base 10, written as .
Key relationship:
This relationship allows us to move between a number and its logarithm.
Examples:
- because
- because
- because
Properties of logarithms to the base 10
Understanding these three properties will help you work confidently with logarithms:
Three key properties of base 10 logarithms:
1. Numbers greater than one
If a number is greater than , its logarithm to base is positive (greater than zero).
For example: , which is positive.
2. Numbers between zero and one
If a number is greater than but less than , its logarithm to base is negative.
For example: , which is negative.
3. Zero and logarithms
If the number is , then its logarithm is undefined.
You cannot take the logarithm of zero or any negative number.
The effect of the logarithmic scale
Let's examine what happens when we plot the same set of numbers on both a linear scale and a logarithmic scale.
Consider again the numbers:
These numbers range from to million. On a linear scale, the first seven numbers would cluster at one end, whilst the last number ( million) would be far away at the other end. This makes it difficult to distinguish between the smaller values.
However, when we plot the logarithms of these numbers (that is, the values ), they are evenly spread along the scale. This even spacing makes it much easier to compare values across the entire range.
This is the key idea behind using logarithmic scales for data display. Instead of plotting the original data values, we plot their logarithms. This transformation spreads out values that were previously bunched together.
Logarithmic transformation
A logarithmic transformation changes the scale on the horizontal axis from to . In this process, we replace each data value with its logarithm.
This transformation is particularly useful when:
- Data values range over several orders of magnitude
- The distribution is highly skewed
- There are extreme outliers
Example: animal body weights
Let's look at a real example using body weights (in kg) of various animal species:
| Weight values (kg) |
|---|
| , , , , , , , , |
| , , , , , , , , |
| , , , , , , , , |
The weights range from kg (possibly a small rodent) to kg (a large dinosaur or whale).
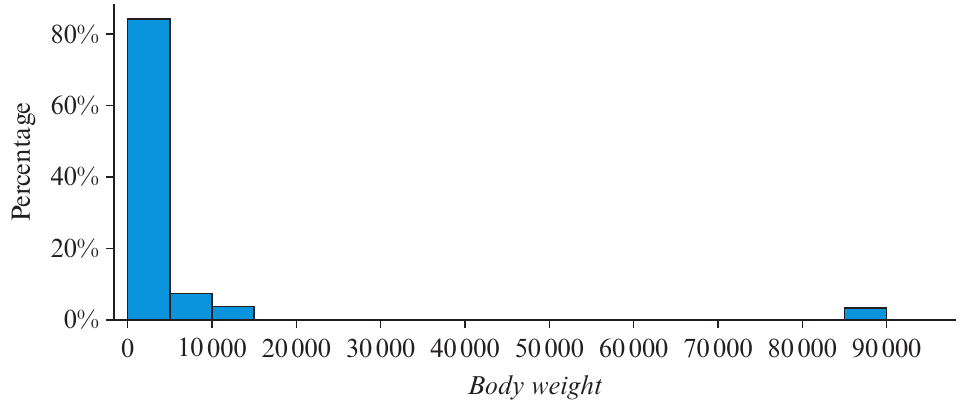
The histogram above shows the distribution of body weights on a linear scale. Notice how:
- Most data (over ) is bunched at the left near zero
- There are small bars around and kg
- An isolated outlier appears around kg
- The distribution is highly positively skewed with an outlier
This histogram doesn't give us much useful information about the majority of the animals.
Now let's apply a logarithmic transformation. We calculate for each animal:
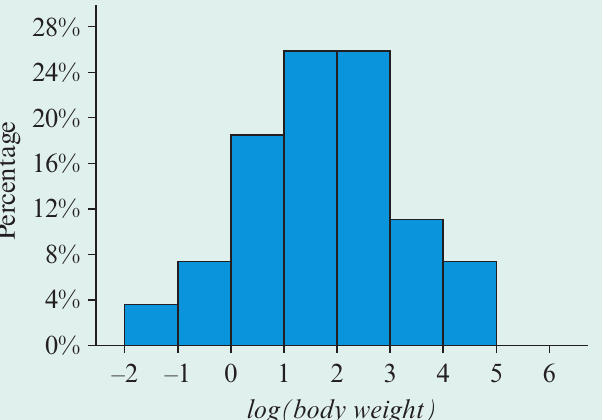
The histogram above shows the same data after logarithmic transformation. Notice the dramatic improvement:
- The data is now spread evenly across the scale
- The distribution appears approximately symmetric
- There are no outliers
- We can clearly see that the percentage of animals with weights between and kg is similar to the percentage between and kg
The logarithmic transformation has revealed a pattern that was hidden in the original data. This demonstrates the power of using log scales when dealing with data spanning multiple orders of magnitude.
Working with logarithms
To construct and interpret histograms using logarithmic scales, you need to be able to:
- Calculate the logarithm of any number (not just exact powers of )
- Work backwards from a logarithm to find the original number
Your CAS calculator is essential for both tasks.
Finding logarithms using a calculator
For numbers that are exact powers of (like ), finding the logarithm is straightforward: .
However, most numbers are not exact powers of . For these, we need a calculator.
Worked Example: Using a calculator to find logs
a) Find the log of , correct to two significant figures.
Solution:
Open your calculator and enter: log(45)
The calculator shows:
Rounded to two significant figures:
b) Find the number whose logarithm equals , correct to the nearest whole number.
Solution:
If , then
Enter into your calculator: 10^2.7125
The calculator shows:
Rounded to the nearest whole number:
Analysing histograms with logarithmic scales
Once you understand how to work with logarithms, you can interpret data displays that use log scales.
Worked Example: Interpreting a histogram with a log scale
The histogram below shows the distribution of body weights for animal species, plotted on a logarithmic scale.
a) What body weight (in kg) is represented by the number on the log scale?
Solution:
If the logarithm equals , then the weight is:
b) How many of these animals have body weights more than kg?
Solution:
From part (a), we know that kg corresponds to a log value of .
Animals with weights greater than kg have log values greater than .
Looking at the histogram, we can count the bars to the right of on the horizontal axis.
There are two animals with log(body weight) greater than 4.
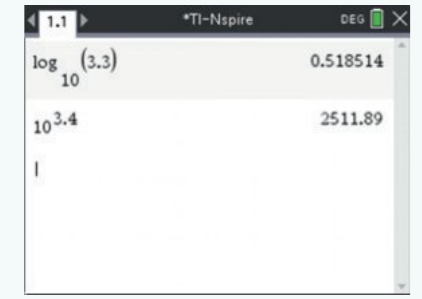
c) A cat weighs kg. Determine the log of its weight, correct to two significant figures.
Solution:
Using a calculator:
Rounded to two significant figures:
d) An elephant has a log(body weight) of . Determine its weight in kg, correct to the nearest whole number.
Solution:
If , then:
Using a calculator:
Rounded to the nearest whole number:
Constructing histograms with log scales
Creating a histogram with a logarithmic scale involves several steps. Modern CAS calculators can perform these calculations and create the graphs automatically.
The general process involves:
- Enter the original data into your calculator
- Create a new variable that contains the logarithms of your data values
- Plot a histogram using the log-transformed variable
- Interpret the result and describe the distribution shape
When you transform data using logarithms:
- A highly skewed distribution often becomes approximately symmetric
- Outliers may disappear as the scale compresses extreme values
- Patterns become easier to identify and interpret
Exam tips
When working with logarithmic scales:
- Always check whether the axis shows the original values or their logarithms
- Remember that equal distances on a log scale represent equal ratios, not equal differences
- Use your calculator for all logarithm calculations unless dealing with exact powers of
- Show your working when converting between logs and numbers
Common errors to avoid:
- Don't try to take the logarithm of zero or negative numbers (undefined)
- Don't confuse with (natural logarithm)
- Remember to round to the requested number of significant figures or decimal places
Key Points to Remember:
- A logarithmic scale spreads out small values and compresses large values, making it ideal for data spanning several orders of magnitude
- Logarithms to base 10 represent numbers as powers of : if , then
- Three key properties: Numbers have positive logs; numbers between and have negative logs; log of zero is undefined
- Logarithmic transformation can change a highly skewed distribution into an approximately symmetric one
- Use your CAS calculator to find logarithms and convert back to original values for numbers that aren't exact powers of