The Graph of the Derivative Function (VCE SSCE Mathematical Methods): Revision Notes
The Graph of the Derivative Function
Understanding derivative graphs
The derivative function tells us about the gradient (slope) of the original function at every point. When we graph the derivative, we create a visual representation of how steep the original function is at each -value.
This relationship between a function and its derivative graph follows predictable patterns that help us sketch derivatives quickly and understand function behavior.
The relationship between quadratic functions and their derivatives
When we have a quadratic function (a parabola), its derivative is always a linear function (a straight line).
Consider a quadratic function with its lowest point (vertex) at coordinates .
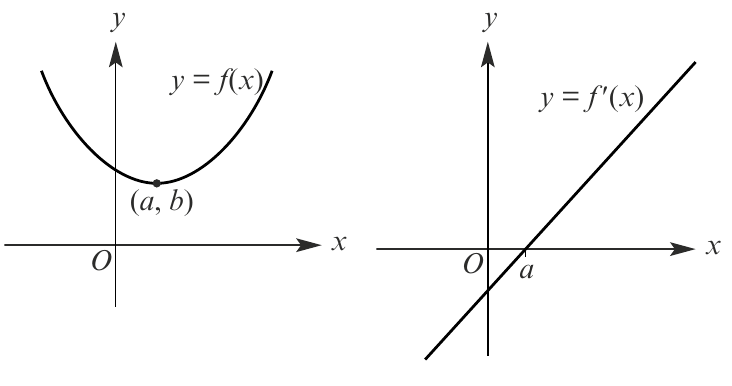
Key observations about the derivative:
- For (left of the vertex): The parabola is sloping downward, so (derivative is negative)
- For (at the vertex): The parabola has zero gradient (horizontal tangent), so
- For (right of the vertex): The parabola is sloping upward, so (derivative is positive)
The derivative graph is therefore a straight line that:
- Crosses the -axis at (where the original function has zero gradient)
- Is below the -axis for (negative gradients)
- Is above the -axis for (positive gradients)
Important principle: Since a quadratic function has degree 2, its derivative has degree 1 (linear). The degree drops by one.
The relationship between cubic functions and their derivatives
When we have a cubic function, its derivative is always a quadratic function (a parabola).
Consider a cubic function that has a local maximum at point and a local minimum at point .
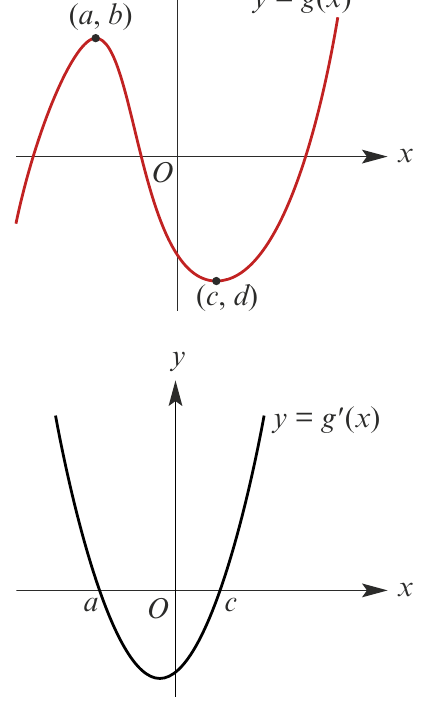
Key observations about the derivative:
- For : The cubic is sloping upward, so (derivative is positive)
- For : Local maximum means zero gradient, so
- For : The cubic is sloping downward between the turning points, so (derivative is negative)
- For : Local minimum means zero gradient, so
- For : The cubic is sloping upward again, so (derivative is positive)
The derivative graph is therefore a parabola that:
- Crosses the -axis at both and (where the original function has turning points)
- Opens upward (in this case)
- Is positive where the cubic function is increasing
- Is negative where the cubic function is decreasing
Important principle: Since a cubic function has degree 3, its derivative has degree 2 (quadratic). Again, the degree drops by one.
Key principles for sketching derivative graphs
To sketch the graph of a derivative function from the original function graph, follow these guidelines:
1. Identify where the gradient is zero
- Look for turning points (local maxima and minima) on the original graph
- Look for points marked as having "zero gradient"
- At these points, the derivative graph crosses the -axis
2. Determine where the gradient is positive or negative
- Where the original function is increasing (going upward as you move right): , so the derivative graph is above the -axis
- Where the original function is decreasing (going downward as you move right): , so the derivative graph is below the -axis
3. Consider the function type
- Linear function → Derivative is a constant (horizontal line)
- Quadratic function → Derivative is linear (straight line)
- Cubic function → Derivative is quadratic (parabola)
- Exponential function → Derivative is also exponential
- Trigonometric function → Derivative is also trigonometric
Worked example: Sketching derivative graphs
Let's practice sketching derivative graphs for various function types.
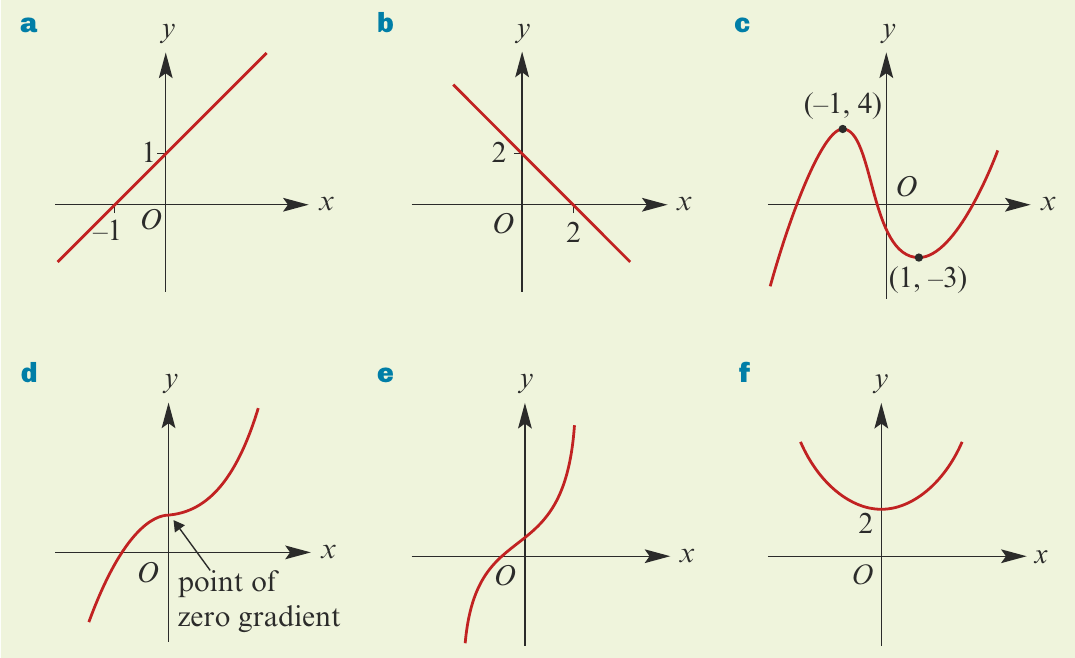
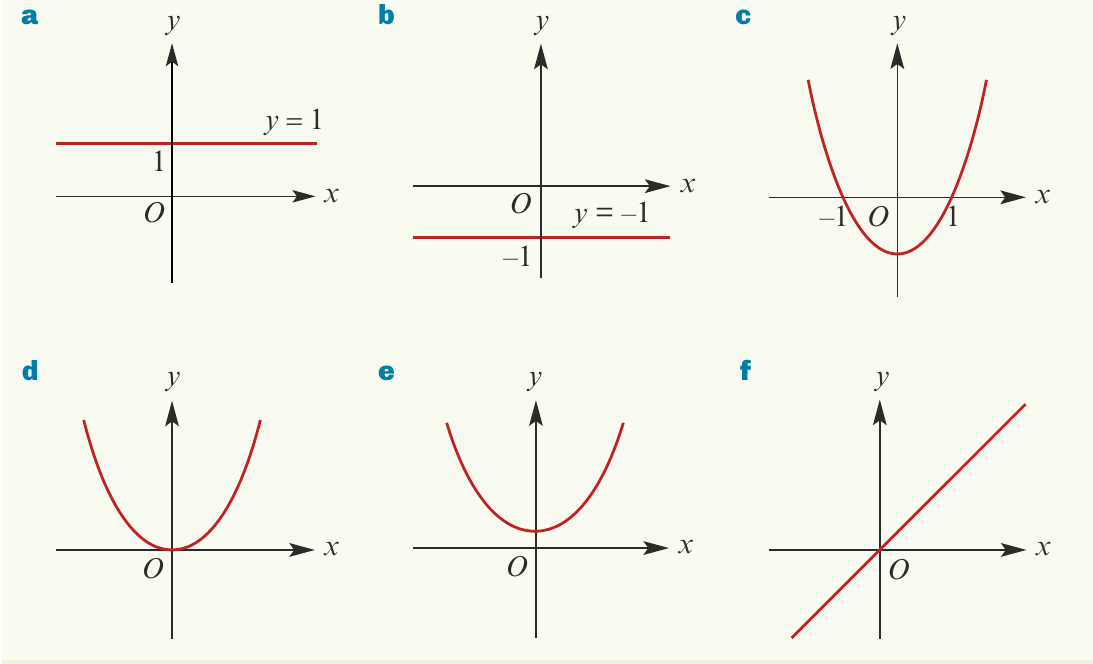
Worked Example: Part a - Linear function with positive gradient
The original function is a straight line sloping upward with constant positive gradient of 1.
Since the gradient is constant everywhere, the derivative is the constant function (a horizontal line).
Part b: Linear function with negative gradient
The original function is a straight line sloping downward with constant negative gradient of -1.
The derivative is the constant function (a horizontal line below the -axis).
Worked Example: Part c - Sinusoidal wave
This curved function has:
- A maximum at where the gradient is zero
- A minimum at where the gradient is zero
- The function increases between the minimum and maximum
- The function decreases between the maximum and minimum
The derivative is a wave-like curve (upward-opening parabola shape) that crosses the -axis at and .
Part d: Cubic-like curve
The graph shows a point of zero gradient (a turning point). The function:
- Decreases before the turning point
- Has zero gradient at the turning point
- Increases after the turning point
The derivative is a parabola opening upward, touching the -axis at the turning point.
Part e: Exponential growth curve
The exponential function is always increasing (never has zero or negative gradient). The gradient gets steeper as increases.
The derivative is always positive and also has exponential shape, staying above the -axis.
Worked Example: Part f - Parabola opening upward
The parabola has its vertex (minimum point) at on the -axis (at ).
The derivative is a straight line (linear function) that:
- Crosses the -axis at (where the parabola has zero gradient)
- Is negative for and positive for
Exam tip: When sketching derivatives, don't worry about getting every detail perfect. Focus on the key features: where it crosses the -axis, where it's positive or negative, and the general shape.
When derivatives don't exist: Non-differentiability
Not all functions have derivatives at every point. A function is not differentiable at points where:
- There is a sharp corner or cusp
- There is a vertical tangent
- There is a discontinuity
The absolute value function example
Consider the function , which can be written as:
This creates a V-shaped graph with a sharp corner at the origin.
To understand why it's not differentiable at , we examine the gradient of the secant line through points and :
For (approaching from the right):
For (approaching from the left):
The gradient approaches different values (1 from the right, -1 from the left) as . Since these don't match, the limit does not exist, and the function is not differentiable at .
The derivative function is:
Notice that is not defined at .
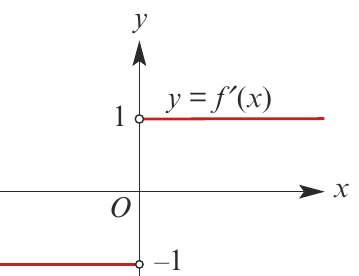
The graph shows two horizontal lines (at and ) with open circles at , indicating the derivative doesn't exist there. This is called a jump discontinuity.
Worked Example: Derivative with non-differentiable point
Draw a sketch graph of where the graph of forms a triangular peak with vertex at and base points at and .
Solution:
The function consists of two straight line segments meeting at a sharp point at .
- For : The function has constant positive gradient of 2
- For : The function has constant negative gradient of -2
- At : The function is not differentiable (sharp corner)
Therefore, the derivative graph consists of:
- A horizontal line at for
- A horizontal line at for
- The derivative is undefined at (shown with a vertical gap in the graph)
Key insight: Whenever you see a sharp corner or cusp in a function graph, the derivative will have a jump discontinuity at that point.
Remember!
Key Points to Remember:
-
The degree drops by one: Quadratic functions have linear derivatives; cubic functions have quadratic derivatives
-
Zero gradient means crossing: When the original function has a turning point (zero gradient), the derivative graph crosses the -axis
-
Sign tells the story: Positive derivative means the function is increasing; negative derivative means the function is decreasing; zero derivative means a stationary point
-
Sharp corners cause problems: Functions are not differentiable at points where there are sharp corners, cusps, or discontinuities
-
Visual connection is key: Always look at how the slope of the original function relates to the height of the derivative graph