Graphs of Factorised Cubic Functions (VCE SSCE Mathematical Methods): Revision Notes
Graphs of Factorised Cubic Functions
Introduction to cubic functions
A cubic function written in polynomial form has the general structure:
where , , , and are constants, and .
Cubic functions produce a variety of different graph shapes depending on the values of these coefficients. Unlike quadratic functions, the graph of a general cubic function is not simply a transformation (such as a dilation, translation, or reflection) of the basic cubic graph .
Key features of cubic graphs
All cubic functions have at least one x-axis intercept. The number of x-axis intercepts can be:
- One intercept
- Two intercepts
- Three intercepts
The y-axis intercept is straightforward to find. We substitute into the equation, which gives us the point .
Sketching factorised cubic functions
When sketching cubic graphs that are not in the simple form , we begin by finding the x-axis intercepts. This is easiest when the cubic is already factorised.
Worked Example: Sketching a Factorised Cubic
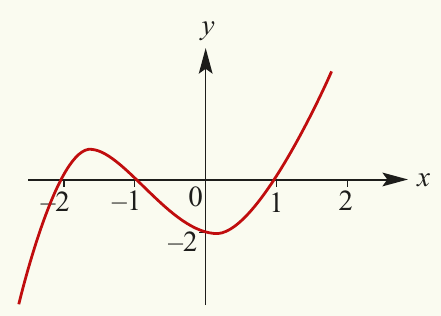
Sketch the graph of .
Finding the x-axis intercepts:
To find where the graph crosses the x-axis, we set :
This gives us:
Therefore, the x-axis intercepts are at , , and .
Finding the y-axis intercept:
To find where the graph crosses the y-axis, we set :
Therefore, the y-axis intercept is at .
Checking the sign of y in different regions:
We can test values in each region to determine whether is positive or negative:
-
When ,
-
When ,
-
When ,
-
When ,
Notice how the sign of the y-value changes from one side of an x-axis intercept to the other.
Behaviour beyond the intercepts:
Finally, we consider what happens to the graph beyond the x-axis intercepts:
- For : and as increases, increases
- For : and as decreases, decreases
Effect of a negative leading coefficient
The polynomial form of the cubic in the previous example is . The coefficient of is positive (it's 1). Let's see what happens when the coefficient of is negative.
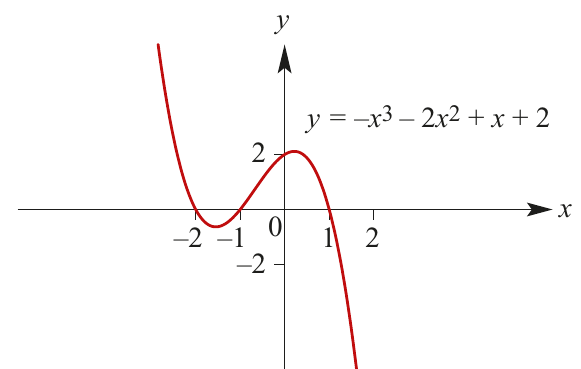
The graph of the cubic function:
is the reflection in the x-axis of the graph from the previous example.
Sign analysis for this function:
- When ,
- When ,
- When ,
- When ,
Behaviour beyond the intercepts:
- For : and as increases, decreases
- For : and as decreases, increases
At this stage, the exact location of the turning points is not specified. However, it's important to note that unlike quadratic graphs, the turning points of cubic graphs are not symmetrically located between x-axis intercepts.
Sign diagrams
A sign diagram is a number-line diagram that shows when an expression is positive or negative. This is a very useful tool for sketching cubic functions.
The following diagram shows both a cubic function graph and its corresponding sign diagram:
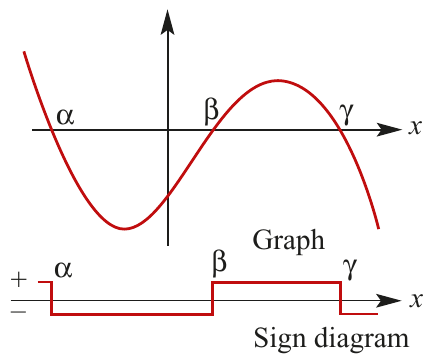
Using a sign diagram requires that we first find the factors and the x-axis intercepts. We can then use the y-axis intercept and sign diagram together to complete the graph.
Worked Example: Using a Sign Diagram
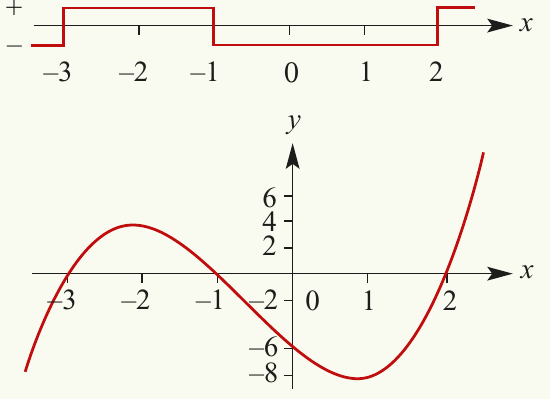
Sketch the graph of .
Step 1: Factorise the cubic
Let
Testing for factors:
Therefore, is a factor.
By division, we can write:
Step 2: Find the x-axis intercepts
The x-axis intercepts are at , , and .
Step 3: Create a sign diagram
We determine the sign of in each region:
- When , is negative
- When , is positive
- When , is negative
- When , is positive
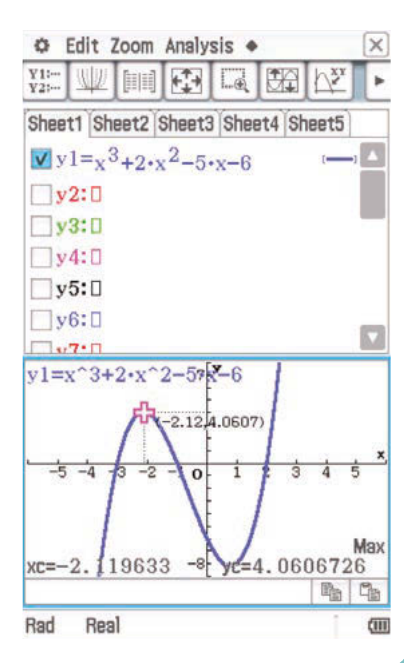
Using technology to find turning points:
A calculator can be used to find the coordinates of turning points. For this function, the turning points are approximately at and .
Repeated factors
A polynomial function such as has a repeated factor. In this case, is repeated.
Because the repeated factor is squared, the sign of the y-value is the same on either side of the corresponding x-axis intercept (close to that intercept).
When a factorised cubic has a repeated factor and another linear factor, there are only two x-axis intercepts, and the repeated factor corresponds to one of the turning points.
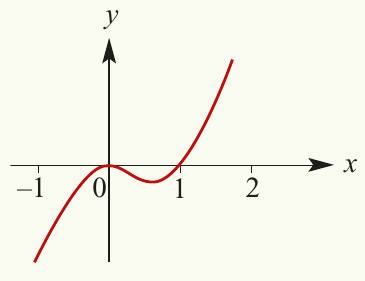
Worked Example: Sketching with a Repeated Factor
Sketch the graph of .
Finding the x-axis intercepts:
Setting :
The x-axis intercepts are at and .
Because the repeated factor is , there is also a turning point at .
Finding the y-axis intercept:
Setting gives .
The y-axis intercept is at .
Cubics with one x-axis intercept
Cubics of the form have only one x-axis intercept. However, some other cubics also have only one x-axis intercept because when they are factorised, they have only one linear factor, with the remaining quadratic factor unable to be factorised further.
Worked Example: Cubic with One X-axis Intercept
Sketch the graph of .
Finding the x-axis intercept:
First, we check whether the factor can be factorised further using the discriminant:
Since , there are no further linear factors.
Therefore, when solving , there is only one solution.
The x-axis intercept is at .
Finding the y-axis intercept:
Setting :
The y-axis intercept is at .
A calculator can be used to find the turning points at and approximately .
At this stage of your studies, you cannot determine all features of a general cubic polynomial graph by hand. Further techniques will be introduced later in your course.
Key Points to Remember:
- The graph of a cubic function can have one, two, or three x-axis intercepts
- To find x-axis intercepts, set and solve for
- To find the y-axis intercept, set
- Sign diagrams help visualise where the function is positive or negative between intercepts
- If a cubic has a repeated factor to the power 2, the y-values have the same sign immediately to the left and right of the corresponding x-axis intercept
- The sign of the coefficient of determines the overall shape: positive means the graph rises to the right, negative means it falls to the right