Solving Quadratic Inequalities (VCE SSCE Mathematical Methods): Revision Notes
Solving Quadratic Inequalities
What are quadratic inequalities?
A quadratic inequality is similar to a quadratic equation, but instead of an equals sign, it uses an inequality symbol such as , , , or . For example:
Unlike linear inequalities, quadratic inequalities require a graphical approach because the relationship between and is curved, not straight. This means we need to consider where a parabola sits relative to the -axis.
The curved nature of quadratic functions makes it difficult to solve inequalities algebraically alone. By sketching the graph, we can visually see which regions satisfy the inequality, making the solution much clearer.
The three-step method
Here's a reliable three-step method to solve any quadratic inequality:
Step 1: Solve the corresponding equation
First, change the inequality symbol to an equals sign and solve the resulting quadratic equation. This gives you the x-intercepts of the parabola.
For example, if solving , you would solve:
Step 2: Sketch the graph
Sketch the graph of the quadratic function using the -intercepts you found in Step 1. You should also identify whether the parabola opens upward or downward by looking at the coefficient of .
If the coefficient of is positive, the parabola opens upward (U-shaped). If it's negative, the parabola opens downward (upside-down U).
Step 3: Use the graph to determine the solution
Look at your sketch and identify the -values where the parabola satisfies the inequality:
- For or : find where the graph is above the x-axis
- For or : find where the graph is below the x-axis
The solution will typically be expressed as an interval or union of intervals.
Memory Aid: "SSU"
Remember the three steps as Solve, Sketch, Use:
- Solve the corresponding equation
- Sketch the graph
- Use the graph to find the solution
Worked example
Worked Example: Solve
Step 1: Solve the equation
Step 2: Sketch the graph of the quadratic
Since the coefficient of is positive (), the parabola opens upward. The -intercepts are at and .
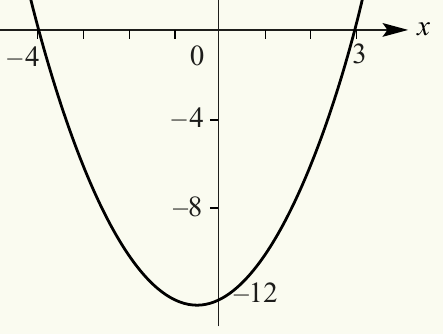
Step 3: From the graph, we can see that when the parabola is above the -axis.
This occurs when or .
Solution: x < -4 or x > 3
Key strategy
When solving quadratic inequalities of the form (or with , or ), sketching the graph of is the most effective strategy. The visual representation makes it easy to see which -values satisfy the inequality.
You can also use a calculator to help solve quadratic inequalities, but understanding the graphical method is essential for developing your mathematical reasoning.
Remember!
Key Points to Remember:
- Quadratic inequalities require a different approach than linear inequalities due to the curved relationship
- Always follow the three steps: Solve the equation, Sketch the graph, Use the graph
- The sign of the coefficient of tells you whether the parabola opens upward (positive) or downward (negative)
- For or inequalities, look for where the graph is above the x-axis
- For or inequalities, look for where the graph is below the x-axis
- The solution often involves two separate intervals (like or )