Quadratic Rational Functions (AQA A-Level Further Maths): Revision Notes
Quadratic Rational Functions
Introduction
When working with quadratic rational functions, you'll be sketching curves that have both a quadratic numerator and a quadratic denominator. These functions can have interesting features like asymptotes (lines the curve approaches but never touches) and turning points that require careful algebraic analysis. Understanding how to identify these features systematically is essential for accurate curve sketching.
While graphical calculators are useful for checking your work, exam questions require you to determine all key features using algebraic methods alone. Mastering these techniques is crucial for exam success.
What is a quadratic rational function?
A quadratic rational function is a function that can be written in the form:
where both the numerator and denominator are quadratic expressions. Unlike simple rational functions with linear terms, these functions can have both vertical and horizontal asymptotes, and their graphs can display more complex behavior, including turning points.
The key to successfully sketching these curves lies in identifying several important features through algebraic methods.
Key features when sketching
When sketching the graph of a quadratic rational function, you need to systematically identify four main features. This process follows a logical sequence that builds up a complete picture of the curve's behavior.
The four key features are:
- Intercepts: The points where the curve crosses the x-axis and y-axis
- Asymptotes: Both vertical asymptotes (where the function is undefined) and horizontal asymptotes (the value the function approaches as x becomes very large)
- Range: The set of all possible y-values that the function can take, which helps identify any restrictions
- Turning points: Any maximum or minimum points on the curve
I-A-R-T Strategy for Success
Remember this sequence: Intercepts → Asymptotes → Range → Turning points
By working through these features in this order, you can build a complete sketch of the curve systematically. Always verify your sketch using a graphical calculator at the end.
Finding intercepts
Intercepts tell you where the curve crosses the coordinate axes. These are often the easiest features to find and provide important reference points for your sketch.
To find the y-intercept: Substitute x = 0 into the equation and solve for . This gives you the point where the curve crosses the y-axis.
To find the x-intercepts: Set y = 0 and solve the resulting equation. This means solving:
A fraction equals zero only when its numerator equals zero (provided the denominator is not also zero at that point). Therefore, solve:
Critical Check for X-Intercepts
You must verify that the denominator is not zero at the x-intercept values. If the denominator is also zero at these points, the function is undefined there rather than crossing the axis - this would indicate a discontinuity, not an intercept.
Finding asymptotes
Asymptotes are crucial features that define the boundaries of the curve's behavior. They show you where the function is undefined (vertical asymptotes) and what value the function approaches for very large x-values (horizontal asymptotes).
Vertical asymptotes
A vertical asymptote occurs when the denominator of the rational function equals zero, making the function undefined. As x approaches this value from either side, the function values become infinitely large (positive or negative).
To find vertical asymptotes: Solve the equation . Each real solution gives an x-value where there is a vertical asymptote.
The V-H Asymptote Rule
- Vertical asymptotes: Set the denominator equal to zero
- Horizontal asymptotes: Use the ratio of leading coefficients
For example, if , then , giving vertical asymptotes at and .
If the denominator has no real solutions (discriminant < 0), then there are no vertical asymptotes, and the function is defined for all real x-values.
Horizontal asymptotes
A horizontal asymptote describes the behavior of the function as x becomes very large (positive or negative). For quadratic rational functions, this is found by examining the ratio of the leading terms.
To find the horizontal asymptote: As , the function approaches:
This is simply the ratio of the coefficients of in the numerator and denominator.
Alternative method: Substitute a very large value of x (such as ) and observe that , so the function approaches the ratio of leading coefficients.
Curves CAN Cross Horizontal Asymptotes!
Unlike vertical asymptotes, a curve can cross its horizontal asymptote. This is a common misconception. The horizontal asymptote describes behavior as , but at specific finite x-values, the curve can equal the asymptote value.
To find where this crossing occurs, solve where k is the horizontal asymptote value.
Finding the range
The range of a function is the set of all possible y-values. For quadratic rational functions, certain y-values may be impossible to achieve due to the structure of the function. Finding these restrictions helps identify maximum and minimum points.
Method for finding the range:
- Consider the equation where k represents a general y-value
- Rearrange the equation to make x the subject
- Apply the discriminant condition: For x to have real solutions, the discriminant must be non-negative
Let's work through this systematically. Starting with:
Set and rearrange:
The DAD Method for Range
- Discriminant must be for real x
- Apply to the rearranged equation
- Deduce the range from the resulting inequality
For x to take real values, we need for this quadratic equation.
Substituting our coefficients:
Expanding and simplifying this inequality gives you the range of possible k-values, which are the possible y-values.
The boundaries of this range often correspond to turning points on the curve. Additionally, any horizontal asymptotes restrict the range, as the function can only approach (but might not equal) the asymptote value except at specific crossing points.
Finding turning points
A turning point is a point where the curve changes direction, representing either a local maximum or minimum. For quadratic rational functions, turning points occur at the boundary values of the range.
Method for finding turning points:
- Identify the range limits: From your range calculation, find the maximum and minimum possible y-values
- Substitute these y-values back into the original equation
- Solve for x to find the x-coordinate of each turning point
- Determine the nature: The minimum y-value corresponds to a minimum point, and the maximum y-value corresponds to a maximum point
Special Considerations for Turning Points
- If one boundary of the range is a horizontal asymptote, there is no turning point at that limit (the curve approaches but never reaches it)
- When substituting a range limit back into the equation, you're solving
- If this gives a repeated root (discriminant = 0), that confirms it's a turning point
Strategy for sketching curves
Follow this systematic approach when sketching quadratic rational functions:
Step 1: Find any points of intersection with the axes (intercepts) and identify any asymptotes using the methods described above.
Step 2: Investigate the regions where y and x have real values. Determine any maxima or minima by analyzing the range of the function.
Step 3: Sketch the curve using all the information gathered. Always use a graphical calculator to verify your sketch, checking particularly that your asymptotes and turning points are correct.
This methodical approach ensures you don't miss any important features and helps you build an accurate representation of the curve.
Worked examples
Worked Example 1: Finding Intercepts and Asymptotes
Question: For the graph of , find the intercepts where the curve crosses the axes, and show that there is no vertical asymptote but that there is a horizontal asymptote at .
Solution:
Finding intercepts:
When :
So the curve crosses the y-axis at (0, -4).
When :
This requires the numerator to equal zero (provided , which is always true).
So the curve crosses the x-axis at (4, 0) and (-4, 0).
Finding asymptotes:
For vertical asymptotes, we need , which gives . This has no real solutions, so there is no vertical asymptote.
For the horizontal asymptote, consider the behavior as x becomes very large:
So y = 1 is a horizontal asymptote.
Alternative verification: Substitute to show the graph approaches the asymptote from above on both sides of the graph.
To find where the curve crosses this asymptote, solve :
This is impossible, so the curve never actually crosses the horizontal asymptote. Therefore, the range is restricted: (since the curve approaches 1 from below).
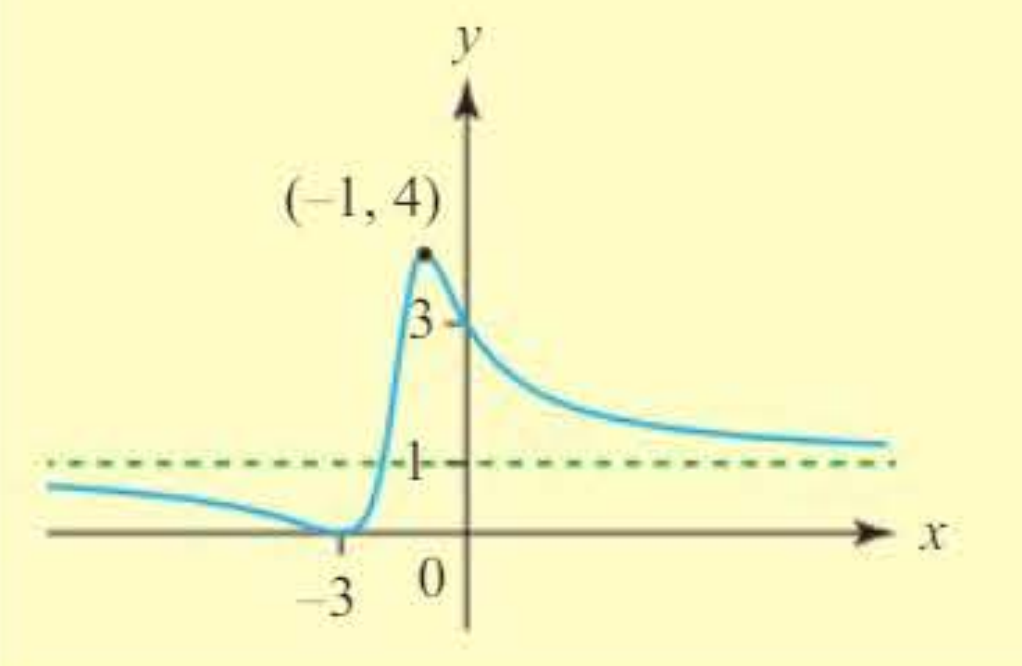
Worked Example 2: Finding Range and Turning Points
Question: Find the range of x and y values for which the graph of exists. Use this information to find any turning points.
Solution:
Finding x-values:
The graph exists for all values of x except where there are vertical asymptotes. Vertical asymptotes occur when the denominator equals zero.
Solve :
Using the discriminant:
Since the discriminant is negative, there are no real solutions. This means the graph exists for all real values of x.
Finding y-values:
To find the range of y, consider where the graph crosses the line and deduce allowable values for k.
Let and rearrange:
For x to take real values when :
This inequality holds when 0 ≤ k ≤ 4.
Therefore, the curve only exists for 0 ≤ y ≤ 4.
Finding turning points:
As x gets very large, , so is a horizontal asymptote.
Since is the only horizontal asymptote and , the values and must correspond to either minimum or maximum points.
When :
So the maximum point is at (-1, 4).
When :
- (provided )
So the minimum point is at (-3, 0).
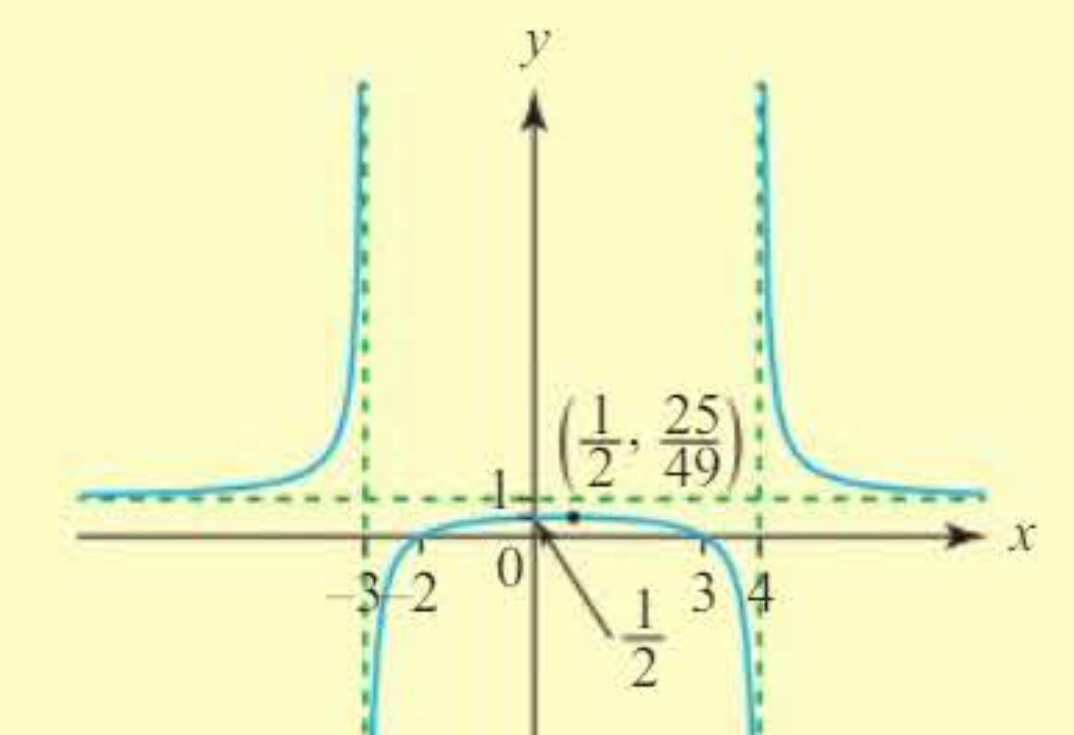
Worked Example 3: Complete Curve Analysis
Question: Identify the key features and sketch the graph of .
Solution:
Finding intercepts:
When :
So the y-intercept is at (0, 1/2).
When :
- (provided )
Check: ✓ and ✓
So the curve crosses the axes at (0, 1/2), (-2, 0), and (3, 0).
Finding asymptotes:
For vertical asymptotes, solve :
So there are vertical asymptotes at x = -3 and x = 4.
For the horizontal asymptote:
So y = 1 is a horizontal asymptote. Substituting confirms the graph approaches this asymptote from above on both sides.
Finding the range:
Let and rearrange:
For real x values, the discriminant must be non-negative:
Factoring out :
This gives: or
However, because of the asymptote at , the function does not actually equal 1 except at specific points. The actual range is:
Finding turning points:
Since is an asymptote as , we only need to check .
When :
So there is a turning point at (1/2, 25/49), which is a maximum point.
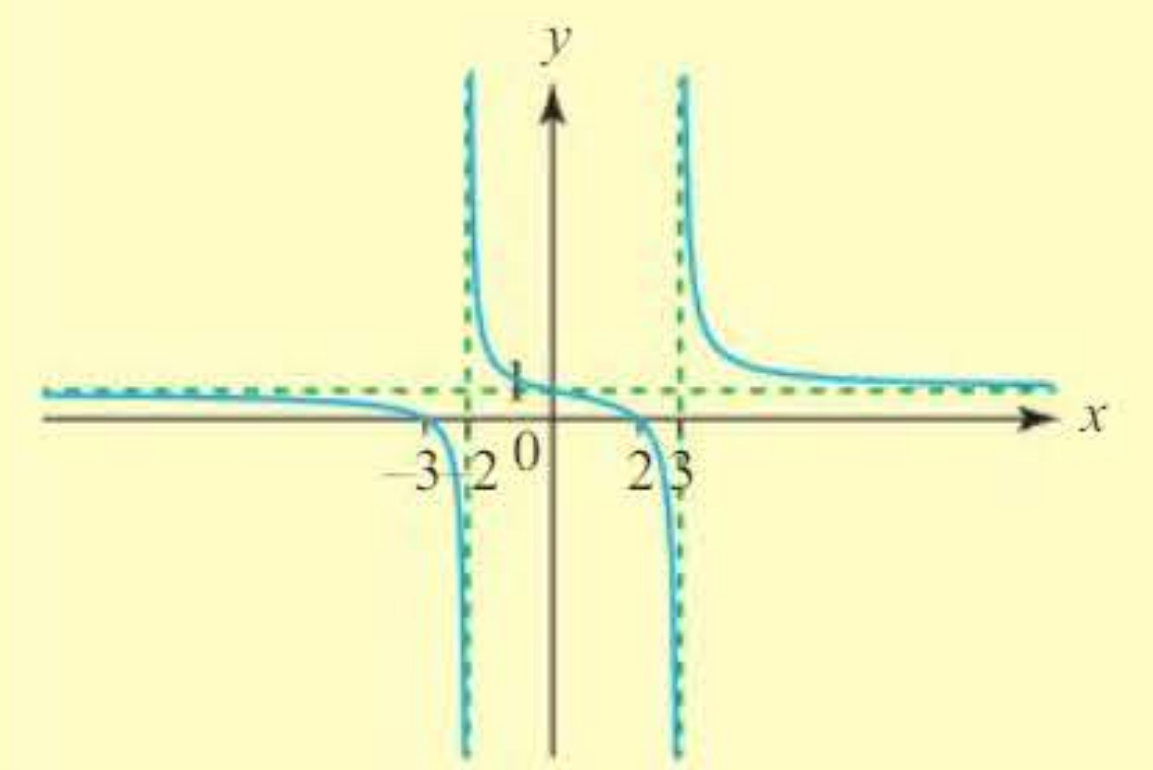
Worked Example 4: Curves Crossing Asymptotes
Question: Sketch the curve .
Solution:
First, factorise both numerator and denominator:
Critical values: The function has potential issues at x = -3, -2, 2, 3.
Sign analysis: Consider the sign of y between and on either side of these values:
- : y is negative
- : y is positive
- : y is negative
- : y is positive
- : y is negative
Notice that every time a critical value of x is passed, y changes from one side of the x-axis to the other.
Intercepts: When , , so the curve passes through (0, 1).
Vertical asymptotes: At x = -2 and x = 3 (where the denominator equals zero).
Horizontal asymptote: As , , so y = 1 is a horizontal asymptote.
Crossing the horizontal asymptote: Solve :
So the curve crosses the horizontal asymptote at (0, 1).
Although the function is not continuous (due to the vertical asymptotes), the curve actually passes through every value of y between the separate branches.
Exam tips
Common Mistakes to Avoid
- Forgetting to check if the denominator is zero at x-intercept values - this could indicate a discontinuity rather than an intercept
- Assuming curves cannot cross horizontal asymptotes - they can!
- Not checking the discriminant is negative when claiming no vertical asymptotes exist
- Confusing the range restrictions imposed by asymptotes with turning point locations
- Making sign errors when expanding brackets in the discriminant inequality - be especially careful when multiplying or dividing by negative numbers
Key Exam Techniques
- Always check your answers using a graphical calculator, especially for intercepts and asymptotes
- When finding the range, remember to change the direction of the inequality if you multiply or divide by a negative number
- A curve can cross a horizontal asymptote at specific points, unlike vertical asymptotes which it can never cross
- In some circumstances, a curve can cross an asymptote multiple times
- Substitute test values (like ) to confirm asymptotic behavior
- The discriminant method is essential for finding the range—practice this technique thoroughly
Remember!
Key Points to Remember
-
A quadratic rational function has the form , with quadratics in both numerator and denominator
-
Follow the I-A-R-T strategy: find Intercepts, Asymptotes, Range, and Turning points systematically
-
Vertical asymptotes occur when the denominator equals zero; horizontal asymptotes are found using the ratio of leading coefficients ()
-
The range is found by rearranging the equation as a quadratic in x and applying the discriminant condition ()
-
Turning points occur at the boundary values of the range—substitute these y-values back to find the x-coordinates
-
Curves can cross horizontal asymptotes but never cross vertical asymptotes
-
Always verify your sketch using a graphical calculator to confirm all features are correctly identified