Critical Path Analysis (Edexcel A-Level Business): Revision Notes
Critical Path Analysis
What is critical path analysis?
Critical path analysis (CPA) is a project management technique used to calculate the minimum time needed to complete a project. It identifies which tasks are critical to keeping the project on schedule and shows how delays in certain activities could impact the overall completion date.
CPA uses network diagrams to map out all the tasks involved in a project, showing their sequence, duration, and dependencies. This visual approach helps businesses plan more effectively and allocate resources efficiently.
Why businesses use CPA
Improving efficiency: Network diagrams reveal which tasks can run simultaneously, saving time and resources. By identifying exactly which delays will impact the project deadline, businesses can prioritise critical tasks and avoid costly overruns. In construction, penalty clauses may apply if deadlines are missed, making accurate time management essential.
CPA provides businesses with a clear picture of which tasks can be delayed without affecting the overall project timeline, allowing for more flexible resource allocation where it matters most.
Better decision making: CPA provides a scientific, objective approach to project planning. Rather than relying on guesswork, managers can estimate completion times based on historical data and task analysis. This leads to more reliable deadlines and helps prevent delays before they occur.
Time-based management: Many businesses aim to minimise the time spent on processes. CPA identifies which tasks must be completed sequentially, which can run in parallel, and which could delay the entire project if not completed on time.
Working capital control: Network diagrams show exactly when resources will be needed. Materials can be purchased just-in-time rather than held as expensive stock. This is particularly valuable for businesses using JIT systems or those that need to borrow to finance materials, as it reduces interest costs and frees up working capital.
CPA is widely used across industries including construction, engineering, software development, product launches, plant maintenance, and aerospace.
Understanding network diagrams
A network diagram visually represents all the tasks in a project and shows how they relate to each other. Let's look at how these diagrams work, starting with a simple example and building up to more complex projects.
Simple networks
In a simple sequential project, tasks must be completed one after another. For example, replacing guitar strings involves five steps that must happen in order:
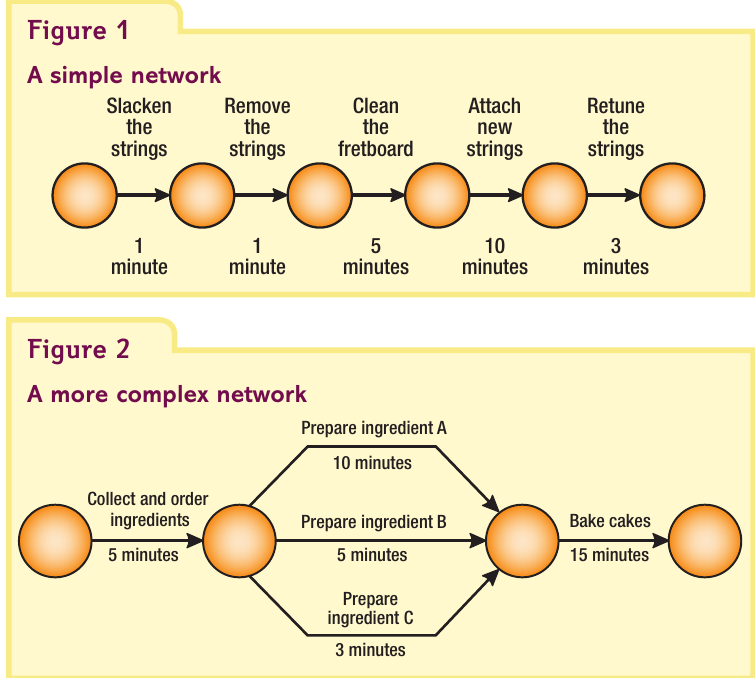
This simple network shows each task flowing in a straight line. The total time is calculated by adding all task durations: minutes.
Complex networks
Most business projects are more complicated, with some tasks that can happen simultaneously (in parallel). For example, when baking cakes, different ingredients can be prepared at the same time:
Notice how three preparation tasks (A, B, and C) can all happen at once after collecting ingredients. The total project time is minutes, because we only need to count the longest parallel task (ingredient A at 10 minutes).
Key features of network diagrams
All network diagrams share certain characteristics:
Arrows and lines represent tasks or activities. Each arrow is labelled with the task name and shows its duration.
Nodes are circles that mark the start and finish points of tasks. Each node is numbered and contains timing information about the project.
Task dependencies are shown by the sequence of arrows. Some tasks can only begin after others are completed.
Parallel tasks can be carried out simultaneously and are shown as multiple arrows coming from the same node.
No crossing lines - arrows should never cross each other to maintain clarity.
Here's a more realistic example - a cottage renovation project that demonstrates how multiple tasks interact in a real-world scenario.
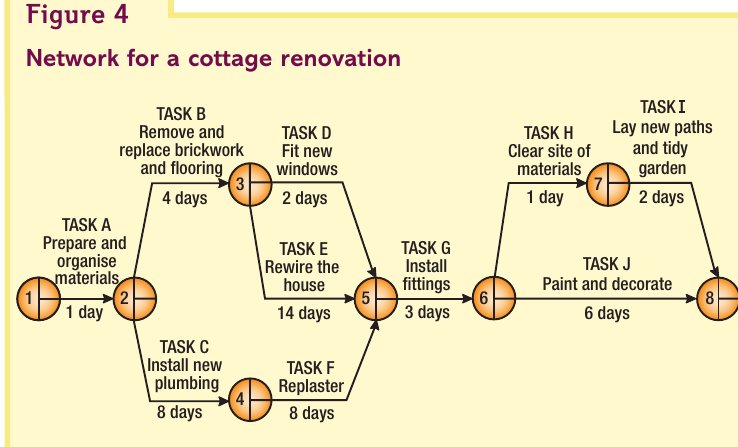
This network shows ten different tasks (A through J) with varying durations. Notice how:
- Task A must be completed first
- Tasks B and C can happen at the same time after Task A
- Task E (rewiring) takes 14 days - the longest single task
- Multiple tasks converge before Task G can begin
- The final node (8) marks project completion
Calculating earliest start times (EST)
The earliest start time (EST) tells you the soonest a task can begin. To find this, you work forward through the network from the start, adding up task durations as you go.
How to calculate EST
Step 1: The first node always starts at 0 (the project begins immediately).
Step 2: Add the duration of each task to find when the next task can start.
Step 3: When multiple paths meet at a node, always choose the longest time. This is crucial - the task at that node cannot begin until ALL preceding tasks are finished.
When multiple paths converge at a node, you must select the longest time. This represents the reality that a task cannot begin until ALL its preceding tasks are completed, not just the shortest one.
Worked Example: Calculating EST for Cottage Renovation
Let's apply EST calculations to the cottage renovation project:
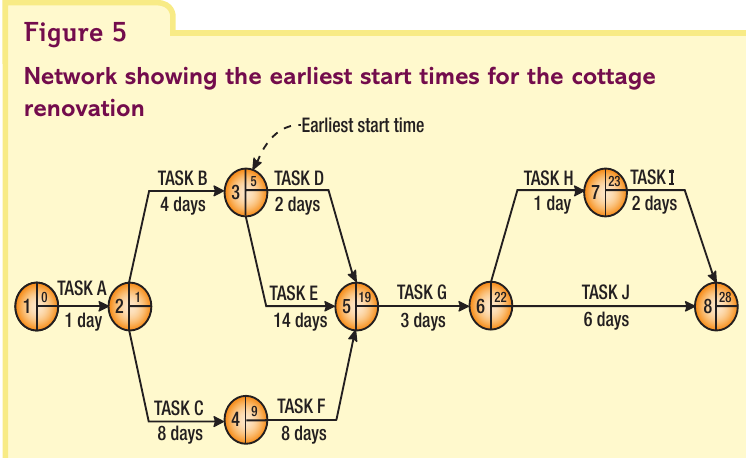
Node 1: Project starts at day 0 (EST = 0)
Node 2: Task A takes 1 day, so Tasks B and C can start after 1 day (EST = 1)
Node 3: Task A (1 day) + Task B (4 days) = 5 days before Tasks D and E can start (EST = 5)
Node 4: Task A (1 day) + Task C (8 days) = 9 days before Task F can start (EST = 9)
Node 5: This is where it gets interesting. Three paths lead here:
- Path 1: A + B + D = days
- Path 2: A + C + F = days
- Path 3: A + B + E = days
Task G cannot begin until ALL preceding tasks are done. The longest path takes 19 days, so EST = 19.
Node 8: Working through the remaining calculations, the project completes after 28 days.
Practice question: advertising campaign
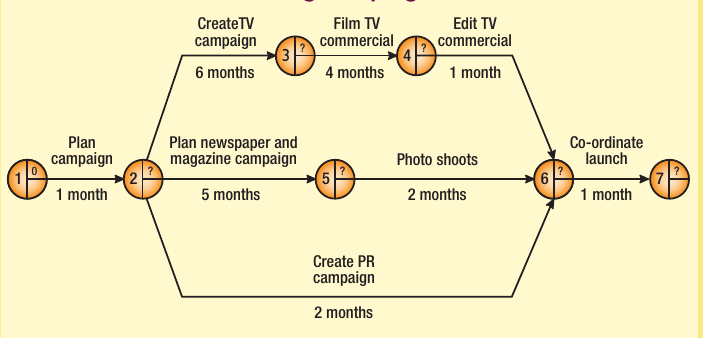
This marketing campaign network shows how different activities run in parallel. When calculating ESTs, remember to identify where paths converge and always select the longest duration.
Calculating latest finish times (LFT)
The latest finish time (LFT) shows the latest a task can be completed without delaying the entire project. Unlike EST calculations which work forward, LFT calculations work backwards from the final node.
How to calculate LFT
Use this formula for each node working backwards:
Worked Example: Calculating LFT for Cottage Renovation
Let's apply this to the cottage renovation, working backwards from completion:
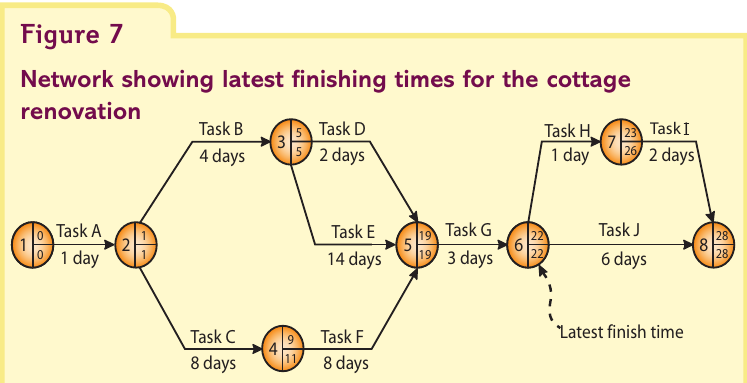
Node 8: The project finishes at day 28, so LFT = 28
Node 7: Working backwards: (Task H) = 26 days
Node 6: Two tasks lead from here:
- Task J takes 6 days: days
- Tasks H + I take 3 days: days
We use the task that takes longest (Task J), so LFT = 22 days.
Node 5: (Task G) = 19 days
Working back through all nodes, you calculate when each task must finish to avoid delaying the project.
Identifying the critical path
The critical path is the sequence of tasks that determines the overall project duration. Any delay to tasks on the critical path will delay the entire project.
How to identify the critical path
Look for nodes where EST = LFT. These tasks have no flexibility - they must start and finish at specific times. However, this alone isn't enough. The critical path must also be the longest route through the network.
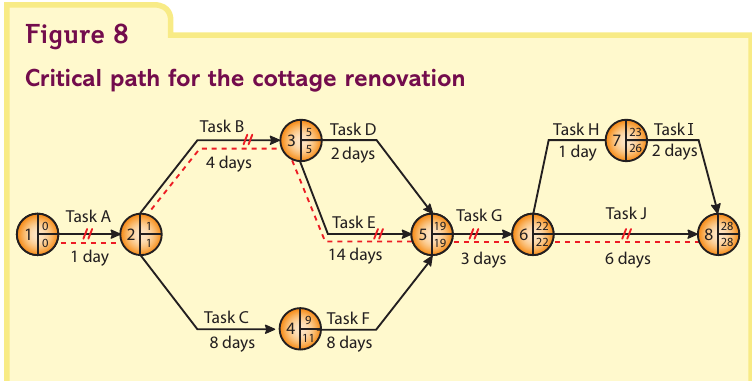
The critical path is identified by two conditions that must BOTH be true:
- EST = LFT at each node (zero float)
- Forms the longest continuous path from start to finish
Both conditions are essential - meeting only one is not sufficient.
In the cottage renovation, the critical path runs through Tasks A, B, E, G, and J. These tasks show EST = LFT at each node and form the longest continuous path from start to finish. The critical path is typically shown using double lines, different colours, or dashed lines.
Tasks not on the critical path (C, D, F, H, I) have some flexibility - they can be delayed slightly without affecting the project completion date.
Understanding float
Float (or slack) is the amount of time a task can be delayed without causing problems. There are two types of float to understand.
Total float
Total float is how long a task can be delayed without delaying the entire project.
Formula:
Worked Example: Calculating Total Float
Example - Task C (installing plumbing):
- LFT = 11 days
- EST = 1 day
- Duration = 8 days
- Total float = 2 days
This means Task C could be delayed by up to 2 days without affecting the project's 28-day completion time.
Example - Task B (brickwork and flooring):
- LFT = 5 days
- EST = 1 day
- Duration = 4 days
- Total float = 0 days
Task B has zero float because it's on the critical path. All critical path activities have zero total float.
Free float
Free float is how long a task can be delayed without delaying the next task.
Formula:
Worked Example: Calculating Free Float
Example - Task F (replastering):
- EST of next task (Task G) = 19 days
- EST of this task = 9 days
- Duration = 8 days
- Free float = 2 days
Task F has 2 days of free float, meaning it can be delayed by 2 days without affecting when Task G starts.
Float summary table
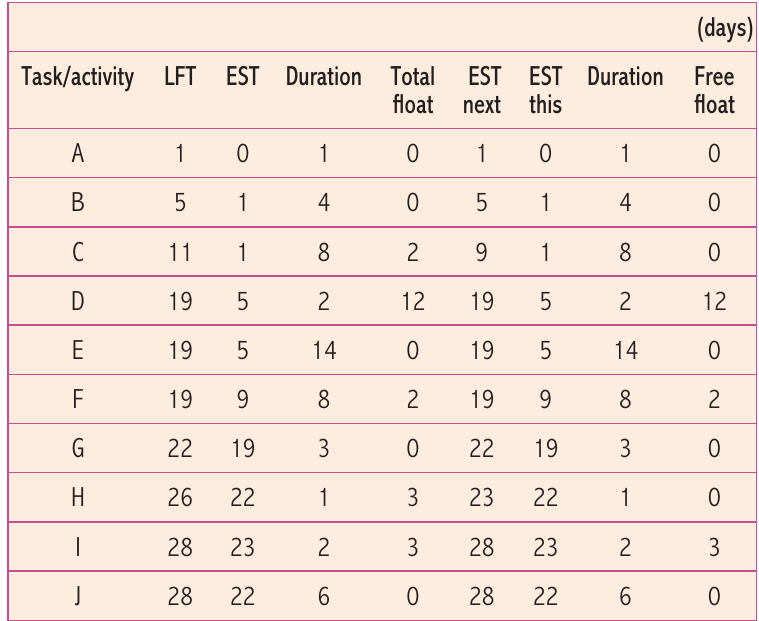
This table shows total float and free float for all tasks in the cottage renovation. Notice that:
- Critical path tasks (A, B, E, G, J) have zero total float
- Off-path tasks have varying amounts of float
- Tasks D and H have high total float (12 and 3 days) but may have different free float values
Limitations of critical path analysis
While CPA is valuable, it has several limitations that businesses must consider:
Inaccurate estimates: Time estimates may be based on previous projects that don't reflect the unique requirements of a new project. Past performance doesn't always predict future timings accurately, especially if conditions have changed.
Changes during the project: Unexpected events can disrupt even well-planned networks. Construction projects might face bad weather delays. Equipment might break down. Suppliers might fail to deliver on time. Businesses need contingency plans to handle these uncertainties.
Resource inflexibility: CPA might identify opportunities to use resources elsewhere during float periods. However, moving resources isn't always practical. For example, if a crane is available for 3 days, but takes 4 days to dismantle, transport, and reassemble at a new location, it cannot realistically be redeployed.
Complexity with large projects: Major projects like skyscrapers or motorways involve hundreds of thousands of tasks. Network diagrams become extremely complicated and difficult to manage manually. However, modern project management software can handle this complexity and automatically recalculate critical paths when changes occur.
Quality of data: The old saying "garbage in, garbage out" applies to CPA. If the initial task list is incomplete or task dependencies are wrong, the entire analysis will be flawed. Careful planning and thorough understanding of the project are essential before creating the network.
Exam skills: using CPA in assessments
When answering exam questions on critical path analysis:
For calculation questions:
- Draw large, clear network diagrams with plenty of space for calculations
- Label all nodes clearly with their numbers
- Use straight lines for arrows and consider using different colours
- Show your working - write the EST in the top right and LFT in the bottom right of each node
- Check your critical path makes sense - it should be the longest route
For analysis and evaluation questions:
- Link CPA to efficiency improvements and cost savings
- Consider how CPA helps with production planning, capacity utilisation, and lean production
- Discuss limitations in context - e.g., resource flexibility for a small business vs. large corporation
- Make synoptic links to other units like operations management, lean production, or working capital management
Common command words:
- Calculate: Show full working for EST, LFT, or float calculations
- Analyse: Explain how CPA benefits the business, considering both advantages and drawbacks
- Evaluate: Judge whether CPA is appropriate for this particular project, weighing costs vs. benefits
Practice question: zinc galvanising process
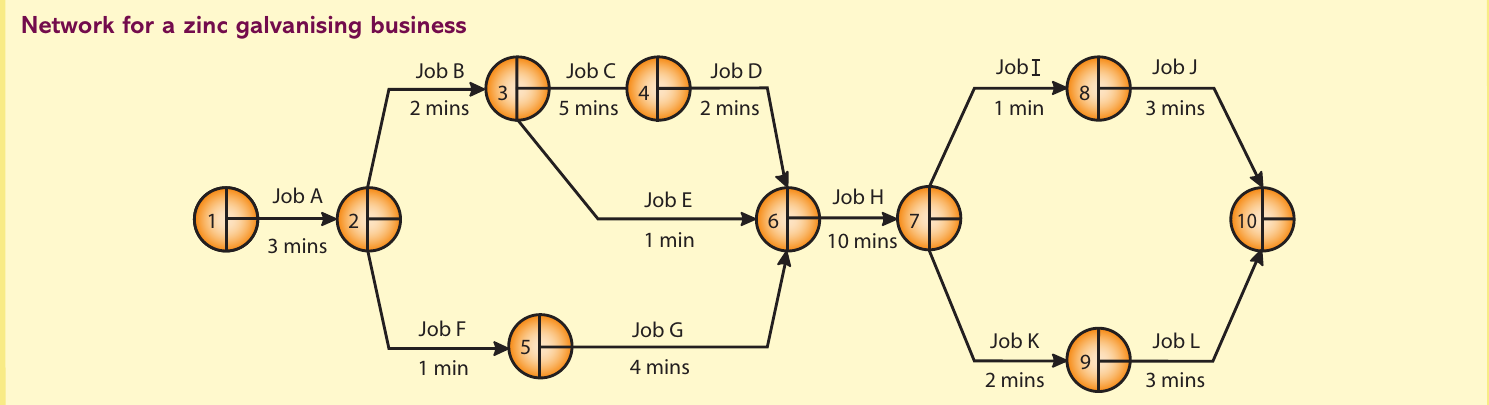
Try working through this network to:
- Calculate all ESTs working forward from Node 1
- Calculate all LFTs working backward from Node 10
- Identify the critical path
- Calculate total and free float for each job
Key Points to Remember:
- Critical path analysis calculates minimum project time and identifies tasks that cannot be delayed
- Network diagrams use nodes (circles) to show start/finish points and arrows to represent tasks
- EST calculations work forward through the network; always choose the longest path when paths converge
- LFT calculations work backwards from the final node using: LFT at node - task duration
- Critical path is where EST = LFT at each node AND forms the longest route through the network
- Total float = LFT - EST - Duration (time a task can be delayed without delaying the project)
- Free float = EST of next task - EST of this task - Duration (time before delaying the next task)
- Limitations include inaccurate estimates, project changes, resource inflexibility, and complexity in large projects