Ratio Analysis (Edexcel A-Level Business): Revision Notes
Ratio analysis
Financial ratios provide a more rigorous and precise way to assess business performance than simply looking at raw figures from financial statements. Ratio analysis involves calculating relationships between different financial values, either by division or expressing one figure as a percentage of another. This technique allows businesses to evaluate their financial health, compare performance over time, and benchmark against competitors.
When examining profit figures alone, it's impossible to judge true performance. For example, a large company making £78.5 million profit might appear more successful than a small firm making £340,500. However, ratio analysis reveals the full picture by relating profit to the size of investment or comparing debt levels to capital structure. This enables meaningful comparisons regardless of business size.
The power of ratio analysis lies in its ability to make fair comparisons between businesses of different sizes. By expressing financial information as ratios or percentages, we can compare a small business with a multinational corporation on equal terms.
Understanding gearing ratios
Gearing ratios examine the long-term financial stability of a business by analysing its capital structure. These ratios measure the relationship between borrowed funds (on which interest must be paid) and shareholders' equity (on which dividends may be paid). Understanding gearing helps stakeholders assess the financial risk associated with a business.
The gearing ratio compares non-current liabilities (long-term loans) to capital employed. Capital employed represents the total amount of money invested in the business and can be calculated by subtracting current liabilities from total assets.
Gearing Ratio Formula:
Where:
Calculating gearing ratios
Let's examine how to apply this formula using real financial data. Consider a farm machinery repair company with the following financial information:
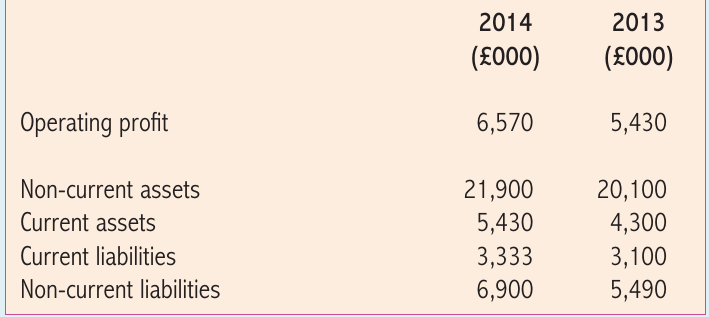
Worked Example: Calculating Gearing Ratios
For 2014:
- Non-current liabilities = £6,900,000
- Capital employed = (£21,900,000 + £5,430,000) - £3,333,000 = £23,997,000
- Gearing ratio = (£6,900,000 ÷ £23,997,000) × 100% = 28.8%
For 2013:
- Non-current liabilities = £5,490,000
- Capital employed = (£20,100,000 + £4,300,000) - £3,100,000 = £21,300,000
- Gearing ratio = (£5,490,000 ÷ £21,300,000) × 100% = 25.8%
Interpreting gearing ratios
Creditors and lenders pay close attention to gearing ratios because they reveal how risky it would be to lend money to a business. Companies with high gearing face greater risk because loan interest represents a fixed financial commitment that must be paid regardless of trading conditions. In contrast, dividends to shareholders are discretionary payments that can be reduced or eliminated during difficult periods.
A business is considered highly geared when loans represent a large proportion of its capital structure relative to shareholders' equity. Generally, gearing ratios above 50% raise concerns among lenders and investors. Below this threshold, the business is considered low geared, indicating lower financial risk.
The 50% Threshold:
- Below 50%: Low geared - considered lower financial risk, more borrowing capacity available
- Above 50%: Highly geared - raises concerns among lenders and investors, limited borrowing capacity
The 50% threshold is a general guideline, and acceptable gearing levels may vary by industry.
In our example, the gearing ratio increased from 25.8% to 28.8% over the two-year period. This remains comfortably within the low-geared range, suggesting the business is not overburdened with debt. The company has room to borrow additional funds if needed for expansion or investment.
Business owners sometimes prefer borrowing to issuing new shares because taking on debt avoids diluting their ownership and control of the company. However, this strategy only remains viable while gearing stays at manageable levels.

Profitability ratios explained
Profitability ratios (also called performance ratios) measure how effectively a business generates returns relative to its size and resources. These ratios go beyond simple profit figures by relating profit to other key financial values such as revenue or capital invested. This provides a more accurate picture of business efficiency and success.
Return on capital employed (ROCE)
Return on capital employed ranks as one of the most important profitability measures, often called the primary ratio. ROCE compares the profit (return) generated by a business with the total amount of money invested (capital employed). This ratio's key advantage is that it accounts for business size, making it possible to compare companies of different scales.
When calculating ROCE, standard practice uses operating profit (also known as earnings before interest and tax, or EBIT). This figure excludes:
- Tax - determined by government policy and outside management control
- Interest - relates to financing decisions rather than trading performance
Using operating profit ensures ROCE focuses purely on operational business performance.
ROCE Formula:
ROCE is considered the primary ratio because it directly measures how efficiently a business uses its invested capital to generate profits.

Calculating ROCE
Using the same farm machinery company's financial data:
Worked Example: Calculating ROCE
For 2014:
- Operating profit = £6,570,000
- Capital employed = £23,997,000
- ROCE = (£6,570,000 ÷ £23,997,000) × 100% = 27.4%
For 2013:
- Operating profit = £5,430,000
- Capital employed = £21,300,000
- ROCE = (£5,430,000 ÷ £21,300,000) × 100% = 25.5%
The ROCE improved from 25.5% to 27.4%, indicating better capital efficiency.

Interpreting ROCE
The interpretation of ROCE depends on several contextual factors. As a general principle, higher ROCE values indicate better performance. In our example, ROCE improved from 25.5% to 27.4%, which appears impressive on the surface.
However, proper assessment requires comparison with:
Industry benchmarks: ROCE varies significantly between sectors. Comparing this company's ratio with competitors in the farm machinery sector reveals whether the performance is genuinely strong or merely average for the industry.
Alternative investments: Investors must consider opportunity cost. If £23,997,000 could earn 3% in a low-risk bank account, the 27.4% ROCE looks extremely attractive. However, the investment carries risk - shareholders could lose everything if the business fails. Therefore, ROCE must significantly exceed safe investment returns to justify the additional risk taken.
Historical trends: Tracking ROCE over multiple years reveals whether performance is improving, stable, or declining. Consistent improvement suggests effective management and sound strategy.
A ROCE of 27.4% means that for every £100 invested in the business, the company generates £27.40 in operating profit. Whether this is "good" depends on the risk involved and what investors could earn elsewhere.
Limitations of ratio analysis
While ratio analysis provides valuable insights, it has significant limitations that users must understand. Ratios should never be used in isolation but as part of a broader assessment of business performance.
Critical Limitation:
Ratio analysis is only as reliable as the financial data it's based on. Always consider the quality and accuracy of underlying financial statements before drawing conclusions from ratios.
Key limitations include:
The basis for comparison
Making meaningful comparisons using ratios requires extreme care. It's essential to compare "like with like" to draw valid conclusions.
Comparisons over time: When analysing the same company across different years, remember that businesses evolve. Some companies diversify into new sectors, while others grow rapidly or contract. A small defence contractor that transforms into a major telecommunications equipment manufacturer will have completely different financial characteristics over time. The appropriate benchmark ratios for this business will change accordingly, affecting how you should interpret the figures.
Inter-firm comparisons: Comparing ratios between companies at a single point in time requires both to operate in similar markets with comparable business models. Comparing a supermarket chain's ratios with a cement manufacturer's ratios provides little useful insight because these businesses have fundamentally different working capital needs, profit margins, and cost structures.
Even companies in the same industry can have subtle but important differences. For instance, two supermarket chains might seem directly comparable, but if one sells predominantly groceries while the other has expanded into electronics, clothing, and household goods, their profit margins and asset structures will differ significantly. This reduces the validity of direct ratio comparisons.
Accounting differences: Even well-matched companies may use different accounting conventions, such as varying depreciation methods or stock valuation techniques. These differences can make ratio comparisons misleading. Additionally, companies with different financial year-end dates present information from different time periods, even if nominally for the "same year". Only the overlapping months are truly comparable.
Quality of final accounts
Ratio analysis depends entirely on the accuracy and reliability of underlying financial statements. Several factors can compromise the quality of accounting information:
Inflation effects: Rising prices distort comparisons between time periods. During high inflation, asset values and revenue might increase dramatically in monetary terms while showing no real growth when adjusted for inflation. This makes historical comparisons difficult and potentially misleading.
Window dressing: Companies can legally manipulate their accounts to present a more favourable (or sometimes less favourable) financial picture. This practice, discussed in detail below, means published accounts may not fully represent the true financial position.
Limitations of the balance sheet
The balance sheet represents a "snapshot" of the business at a specific moment (the financial year-end). This single-day picture might not represent typical conditions throughout the year. For example, a business with peak summer trading that prepares accounts in January will show uncharacteristically low stock and debtor levels. This makes ratio calculations based on year-end figures potentially misleading.
The Snapshot Problem:
A balance sheet shows financial position on one specific day. A company could have unusually high cash one day after receiving a major payment, or unusually low stock just after a major delivery. This single-day figure may not reflect the typical position throughout the year.
Qualitative information ignored
Ratio analysis uses only quantitative (numerical) data from financial statements. However, many crucial performance factors are qualitative and cannot be captured in ratios. In service industries, for example, customer service quality significantly affects sales and profitability. While good customer service might increase sales, ratio analysis cannot isolate its specific impact from other factors like advertising, pricing, or market conditions.
Important qualitative considerations include:
- Staff morale
- Brand reputation
- Management quality
- Customer loyalty
- Innovation capability
- Market position
None of these factors appear in ratio calculations, yet they significantly influence business success.
Window dressing
Accounts must present a "true and fair" record of financial affairs, and legislation sets standards to prevent fraud and misrepresentation. However, within legal limits, businesses can manipulate how they present financial information - a practice called window dressing.
Reasons for window dressing:
-
Impressing shareholders: Management may want to present the best possible financial picture to attract praise, rewards, or prevent criticism from shareholders and the financial press.
-
Attracting investment: When raising new capital, businesses want accounts to look as attractive as possible to potential investors.
-
Strategic positioning: Companies experiencing severe difficulties might deliberately make current figures look even worse, which can improve future year comparisons.
-
Tax management: Making the financial position appear worse can reduce tax liabilities.
-
Preparing for sale: Owners planning to sell the business want the highest possible valuation, which depends on strong financial accounts.
Window dressing is not illegal - it involves using legitimate accounting choices to present information in the most favourable light. However, it can make ratio analysis less reliable by distorting the true financial picture.
Common window dressing techniques:
Businesses can manipulate sales revenue figures to inflate profit in a particular accounting period. They might suppress costs by changing accounting policies or timing when they "write off" unprofitable activities. Other techniques include:
- Writing off bad debts strategically
- Revaluing property assets
- Improving liquidity through sale-and-leaseback arrangements
- Manipulating current assets and liabilities
While the specific methods are complex, you should be aware that published accounts can present a somewhat distorted picture of financial reality.
Key Points to Remember:
-
Gearing ratio measures the proportion of business finance from long-term loans compared to total capital employed. Ratios above 50% indicate high gearing and greater financial risk.
-
Return on capital employed (ROCE) is the primary profitability ratio, comparing operating profit to capital invested. Higher ROCE indicates better performance, but must be compared with industry standards and alternative investment returns.
-
Capital employed = (Non-current assets + Current assets) - Current liabilities. This represents the total investment in the business.
-
Ratio analysis has significant limitations including difficulties making valid comparisons, dependence on accounting quality, and inability to capture qualitative factors. Window dressing can also distort the true financial picture.
-
Always interpret ratios in context - compare with competitors, historical trends, and industry benchmarks rather than viewing figures in isolation.