Mass Spectrometry (OCR A-Level Chemistry A): Revision Notes
Mass Spectrometry
Introduction to mass spectrometry
Mass spectrometry is a powerful analytical technique used to identify organic compounds by determining their molecular mass and providing information about their structure. When an organic sample is analysed using a mass spectrometer, the instrument produces a mass spectrum - a graph showing the different masses of particles detected and their relative abundances.
The technique works by converting molecules into ions, separating them according to their mass-to-charge ratio, and detecting them. The resulting spectrum provides a unique "fingerprint" for each compound, making mass spectrometry invaluable for identifying unknown substances in chemistry, medicine, and forensic science.
The concept of a "fingerprint" is particularly powerful in mass spectrometry because each compound produces a unique pattern of peaks. Just as no two people have identical fingerprints, no two different compounds produce identical mass spectra, making this technique extremely valuable for identifying unknown substances.
Molecular ions and the ionisation process
When an organic compound enters the mass spectrometer, it undergoes ionisation. During this process, the molecule loses one electron and becomes a positively charged ion called the molecular ion, represented as . This ionisation can be shown in an equation. For example, propan-1-ol is ionised as follows:
The molecular ion is crucial because it retains the same mass as the original molecule. The mass spectrometer detects the mass-to-charge ratio () of this molecular ion, which directly gives us the molecular mass of the compound.
For propan-1-ol, the molecular ion appears at , indicating a molecular mass of 60.
Reading and interpreting mass spectra
A mass spectrum displays relative intensity (or relative abundance) on the y-axis and the mass-to-charge ratio () on the x-axis. Understanding how to read this spectrum is essential for identifying compounds.
The molecular ion peak (M⁺ peak)
The molecular ion peak, often called the M⁺ peak, is the most important feature of a mass spectrum. It appears as a clear peak at the highest value on the right-hand side of the spectrum. This peak directly reveals the molecular mass of the compound being analysed.
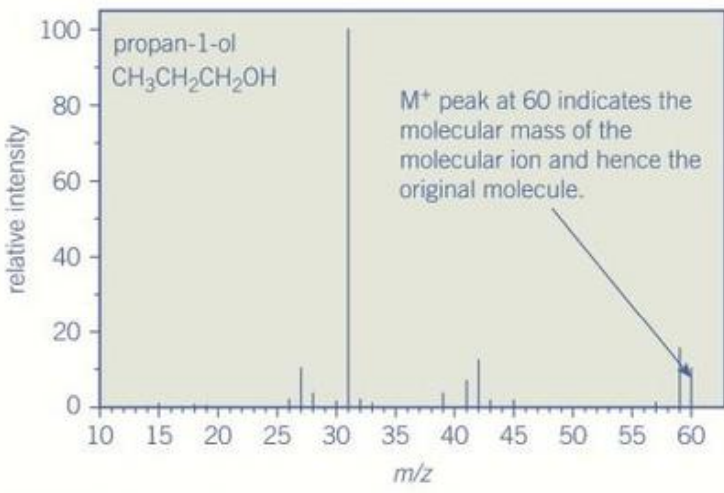
Reading the M⁺ Peak: Propan-1-ol
In the mass spectrum of propan-1-ol shown above, the M⁺ peak appears at . This tells us that the molecular mass of propan-1-ol is 60.
We can verify this by calculating the relative molecular mass:
- Carbon atoms:
- Hydrogen atoms:
- Oxygen atom:
- Total: ✓
The M+1 peak and carbon-13
Just beyond the molecular ion peak, you will often observe a very small peak at one mass unit higher than the M⁺ peak. This is called the M+1 peak. This peak exists because approximately 1.1% of naturally occurring carbon atoms are the carbon-13 isotope () rather than the more common carbon-12 ().
For propan-1-ol with a molecular mass of 60, a small proportion of molecules will contain one atom of , giving them a molecular mass of 61. This creates the small M+1 peak.
The M+1 peak is particularly useful because its size relative to the M⁺ peak can be used to calculate the number of carbon atoms in a molecule using the formula:
Calculating Carbon Atoms from the M+1 Peak
If a mass spectrum shows an M peak with height 74 mm and an M+1 peak with height 4.5 mm, the number of carbon atoms can be calculated:
Step 1: Apply the formula
Step 2: Substitute the values
Step 3: Round to the nearest whole number
This calculation reveals that the compound contains six carbon atoms.
Fragmentation in mass spectrometry
Not all molecular ions remain intact in the mass spectrometer. Many break apart in a process called fragmentation. Understanding fragmentation is key to using mass spectrometry for structural determination.
How fragmentation occurs
Inside the mass spectrometer, some molecular ions break down into smaller pieces called fragments. The simplest fragmentation process splits a molecular ion into two species: a positively charged fragment ion and an uncharged radical.
Critical Concept: Detection in Mass Spectrometry
Only the positively charged fragment ions are detected by the mass spectrometer - the uncharged radicals are not detected. This is crucial for interpreting mass spectra correctly.
For propan-1-ol, one possible fragmentation pathway is:
In this example, the molecular ion breaks to form a fragment ion () at and a radical (). The fragment ion appears as a peak in the mass spectrum (often the base peak - the tallest peak in the spectrum), while the radical is not detected.
Fragment ion patterns
The fragment ions produced create additional peaks in the mass spectrum at various values lower than the molecular ion peak. These fragmentation peaks provide valuable information about the structure of the original molecule.
Each compound produces a unique fragmentation pattern because the way molecules break apart depends on their specific structure, including the arrangement of bonds and functional groups. This uniqueness is what makes mass spectrometry so powerful for identification.
Using fragmentation patterns for identification
The uniqueness of fragmentation patterns makes mass spectrometry extremely useful for identifying unknown compounds and distinguishing between isomers.
Distinguishing between isomers
Even when two molecules are isomers with identical molecular masses, they will produce different fragmentation patterns. This is because their different structures lead to different fragmentation pathways.
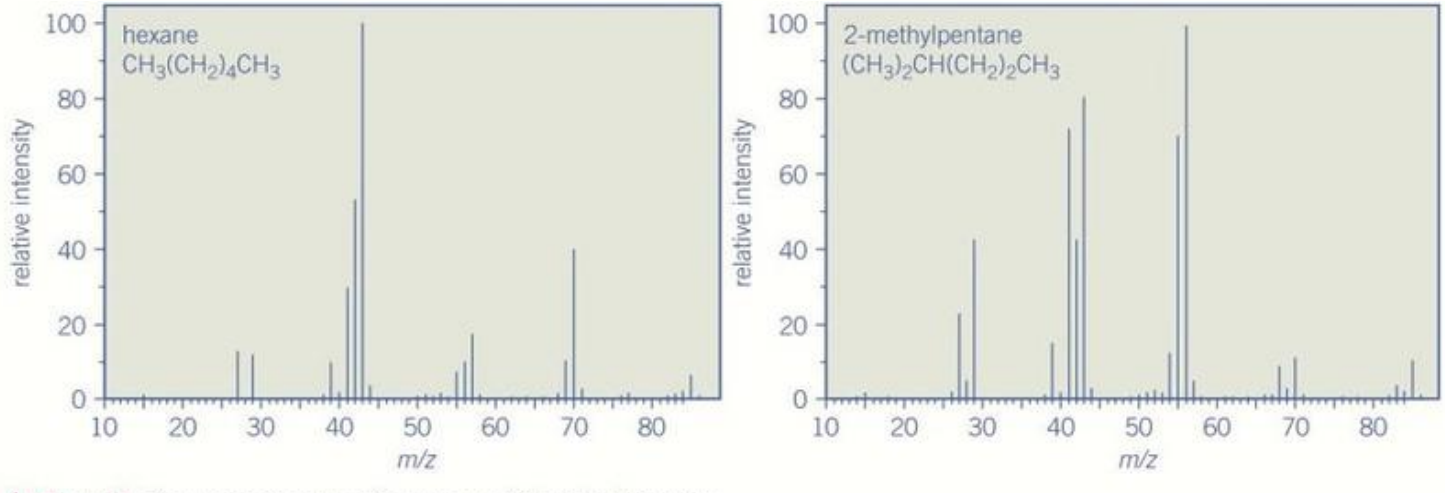
The mass spectra above compare hexane and 2-methylpentane, which are both isomers with the molecular formula . Both compounds show the molecular ion peak at , confirming they have the same molecular mass. However, their fragmentation patterns are distinctly different, allowing us to distinguish between them. The varying heights and positions of the fragment peaks reflect the different ways these molecules break apart due to their structural differences.
Common fragment ions
Certain fragment ions appear frequently in mass spectra of organic compounds. Recognising these common fragments can help you piece together the structure of an unknown molecule.
| Fragment ion | |
|---|---|
| 15 | |
| 29 | |
| 43 | |
| 57 |
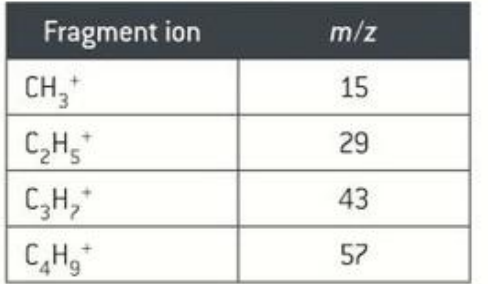
Notice that these fragment ions form a pattern, with each successive fragment increasing by 14 mass units (corresponding to a group). This pattern represents a homologous series of alkyl cations commonly produced when organic molecules fragment.
Interpreting a complete spectrum
Let's examine the mass spectrum of ethanol to see how we can use both the molecular ion peak and fragment peaks to understand a molecule's structure.
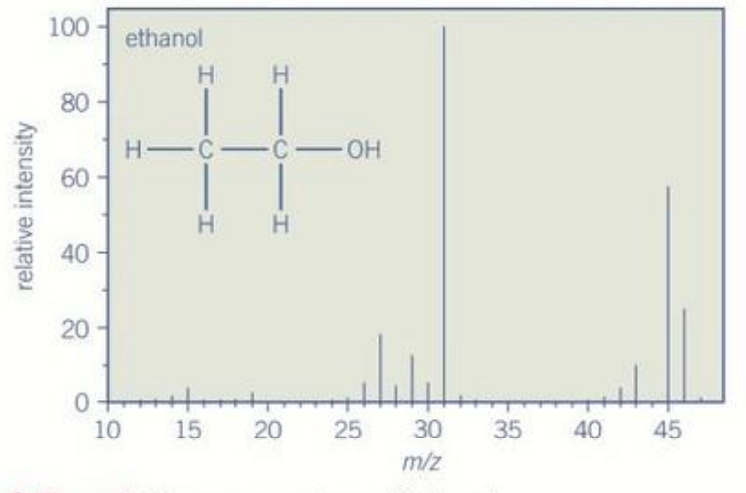
The main features of the ethanol spectrum are:
- Molecular ion peak at , confirming the molecular mass
- M+1 peak at , indicating the presence of carbon-13
- Several fragment ion peaks at lower values
By analysing the fragment peaks, we can identify pieces of the ethanol molecule:
- Peak at corresponds to (methyl cation)
- Peak at corresponds to or (ethyl cation)
- Peak at corresponds to or
- Peak at corresponds to
Helpful Tip: Mass Difference Analysis
It can be helpful to look at the differences between fragment masses and the molecular ion mass. For instance, the difference between the M⁺ peak at 46 and a fragment at 31 is 15, suggesting the loss of a group. This kind of analysis helps confirm structural features of the molecule.
Practical application: drug testing in sport
Mass spectrometry has important real-world applications beyond the chemistry laboratory. One significant use is in drug testing for athletic competitions. During major sporting events like the Olympics, mass spectrometry is used to analyse urine samples and detect banned performance-enhancing substances.

Real-World Application: Detecting Clenbuterol
Clenbuterol is a drug banned in athletic competitions because it is believed to enhance muscle development. Athletes who test positive sometimes claim they consumed contaminated meat, as clenbuterol has been used (though often illegally) in livestock production in some countries.
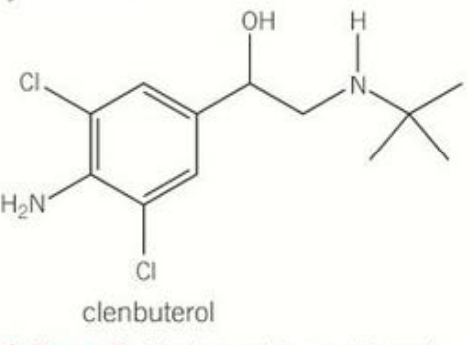
Mass spectrometry can detect even trace amounts of such substances by identifying their unique molecular mass and fragmentation pattern. The molecular ion of clenbuterol can be determined from its structure, and the resulting mass spectrum provides definitive evidence of its presence in a sample.
Key Points to Remember:
-
The molecular ion (M⁺) peak appears at the highest value and directly gives the molecular mass of the compound
-
The M+1 peak occurs due to the carbon-13 isotope (1.1% natural abundance) and can be used to calculate the number of carbon atoms in a molecule
-
Fragmentation produces smaller positively charged fragment ions that are detected, while uncharged radicals are not detected
-
Each compound has a unique fragmentation pattern that acts like a fingerprint, allowing identification of unknown substances
-
Common fragment ions include (15), (29), (43), and (57)