Gantt Charts (AQA A-Level Further Maths): Revision Notes
Gantt Charts
What is a Gantt chart?
A Gantt chart (also called a cascade chart) is a visual tool used to schedule and display project activities. Activities are shown as horizontal bars plotted against a time scale, making it easy to see when each task should start and finish.
Gantt charts are created after you have completed critical path analysis using an activity network. They help project managers visualise the project timeline and identify which activities have scheduling flexibility.
Understanding key timing concepts
Before you can create a Gantt chart, you need to understand several important timing values for each activity.
Activity network notation
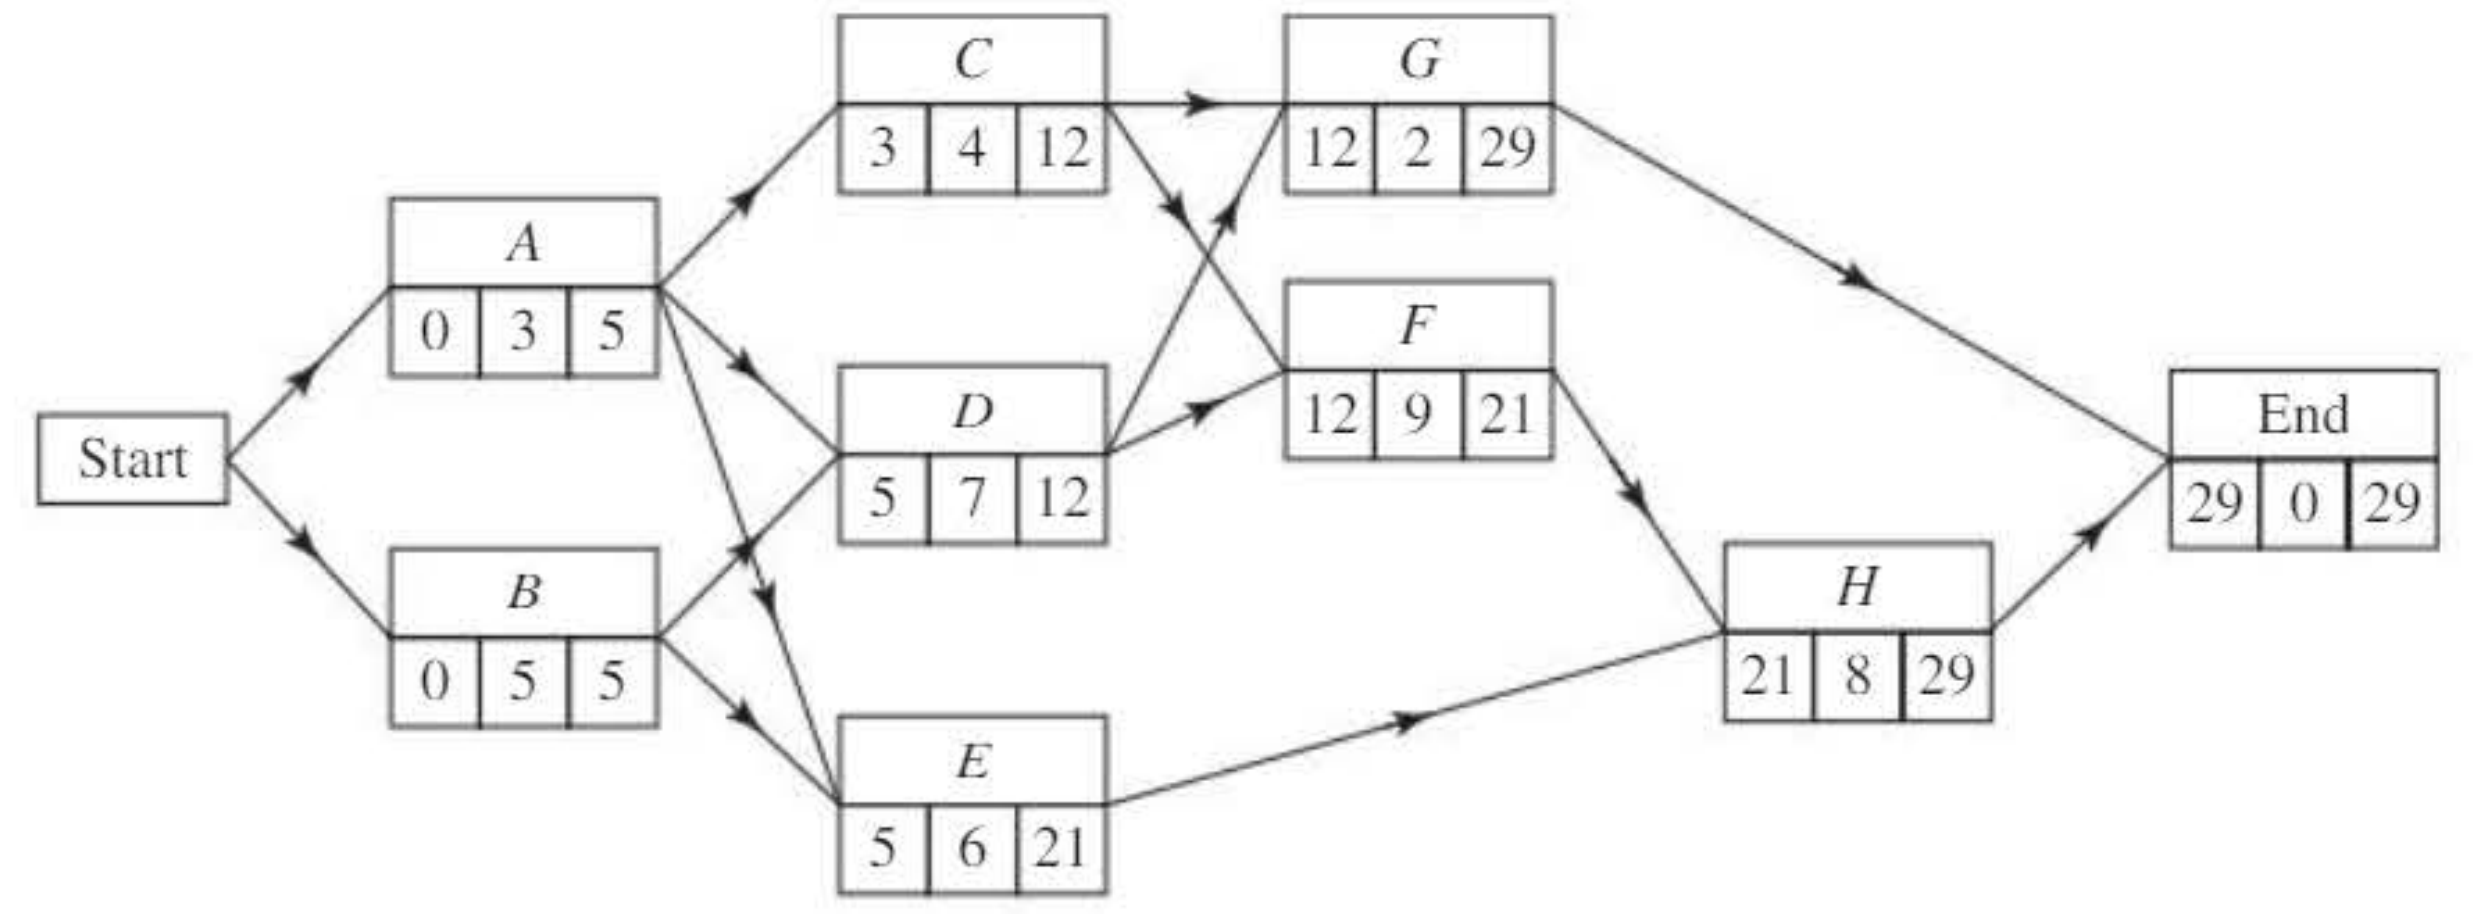
Each activity in an activity network is represented by a box containing three values:
- Top left: Earliest start time
- Bottom left: Duration
- Top right: Latest finish time
Earliest start time
The earliest start time is the earliest possible moment an activity can begin. This is determined by the completion of all preceding activities.
Latest start time
The latest start time is the latest moment an activity can begin without delaying the entire project. This is calculated using:
Earliest finish time
The earliest finish time is the earliest moment an activity can be completed. This is calculated using:
Calculating Earliest Finish Time
Consider activity C from the network above:
- Earliest start time = 3
- Duration = 4
- Earliest finish time = 3 + 4 = 7
Latest finish time
The latest finish time is the latest moment an activity can be completed without delaying the project. This value comes from the backward pass through the activity network.
For activity C:
- Latest finish time = 12
Float
Float (also called total float) measures the flexibility in scheduling an activity. It represents how much an activity can be delayed without affecting the project completion time.
The formula for float is:
This formula tells you the maximum delay possible for an activity without impacting the overall project completion.
Calculating Float
For activity C:
- Float = (12 - 3) - 4 = 5 days
This means activity C can be delayed by up to 5 days without affecting the project completion.
Critical activities and critical path
A critical activity is any activity with zero float. These activities have no scheduling flexibility - they must start and finish at their earliest possible times.
Critical Activities and Critical Path
Critical activities form a critical path through the project network. This is the longest path from start to finish and determines the minimum project duration. Some projects may have multiple critical paths running in parallel.
Non-critical activities have float greater than zero, which means they have some scheduling flexibility. They have both an earliest possible finish time and a latest possible finish time.
Creating a Gantt chart from an activity network
Drawing a Gantt chart follows a systematic three-step process:
Step 1: Calculate timing information
Create a table showing all timing information for each activity. This table should include:
- Activity name
- Duration
- Earliest start time
- Latest start time
- Earliest finish time
- Latest finish time
- Float
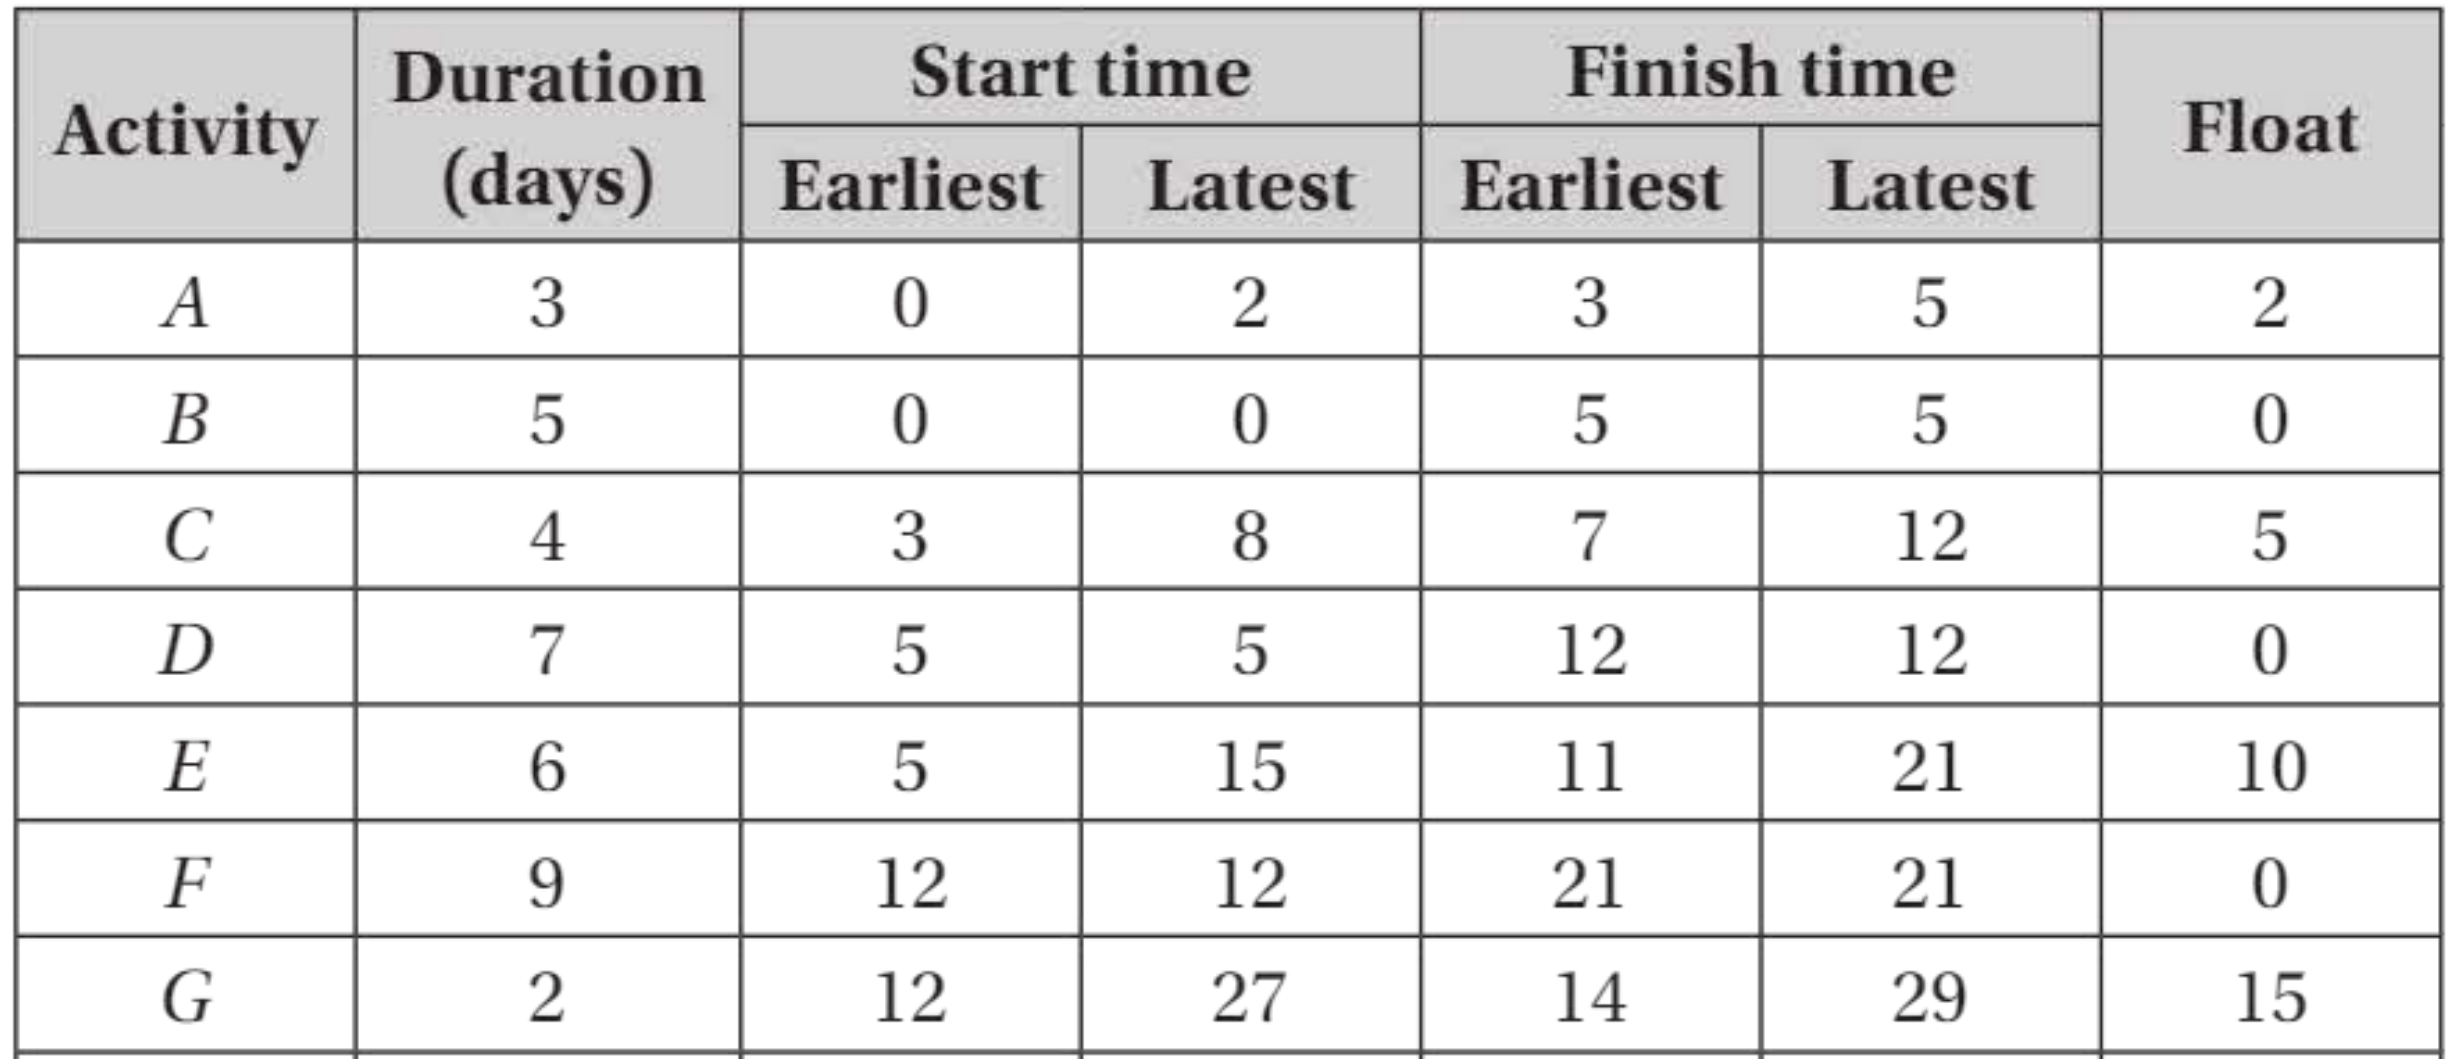
Calculate the float for each activity to identify which activities are critical. Any activity with zero float is on the critical path.
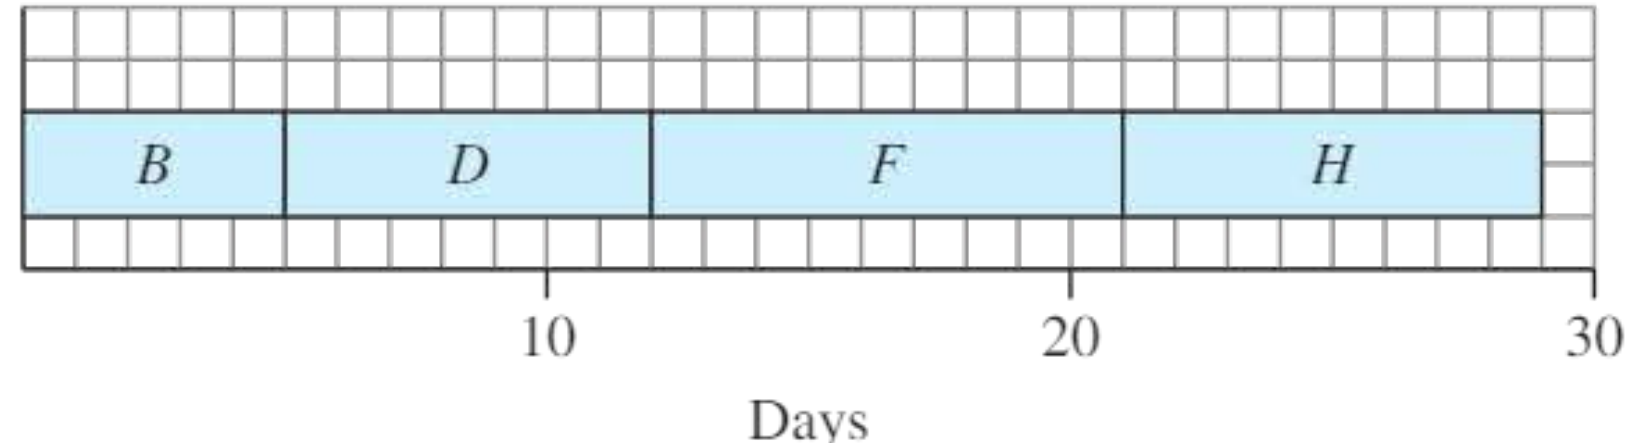
In the example above, activities B, D, F, and H all have zero float, making them critical activities.
Step 2: Identify critical activities
Find all activities with zero float. These are your critical activities and they form the critical path(s) through the project.
Step 3: Draw the Gantt chart
Follow these steps to construct the chart:
- Draw a horizontal time axis scaled appropriately for your project duration
- Plot critical activities first as bars at their scheduled times (since they have no flexibility)
- Add non-critical activities at their earliest start times
- Show the scheduling boundaries for non-critical activities to indicate when they can be moved
For non-critical activities, you can draw a longer bar or use a different notation to show the range from earliest start to latest finish.
For example:
- Activity A could start at time 0 and has a latest finish of 5
- Activity C has earliest start 3 and latest finish 12
- Activity E has earliest start 5 and latest finish 21
- Activity G has earliest start 12 and latest finish 29
When activities have dependencies, you may add a "fence" on the chart to show that one activity cannot start until another is complete. For instance, activity C has 5 days of float, but 2 of those days depend on when activity A finishes.
Gantt chart layouts
There are two common ways to arrange activities on a Gantt chart:
Traditional layout
Activities are arranged with early activities at the bottom and later activities higher up. Each activity typically appears on a separate horizontal line.
Upside-down layout
Activities are arranged with early activities at the top of the diagram, with later activities appearing lower down. This layout is particularly useful when you want to emphasise the chronological flow from top to bottom.
Both layouts are acceptable in examinations - use whichever format you find clearest.
Worked example 1
Worked Example: Drawing a Gantt Chart from an Activity Network
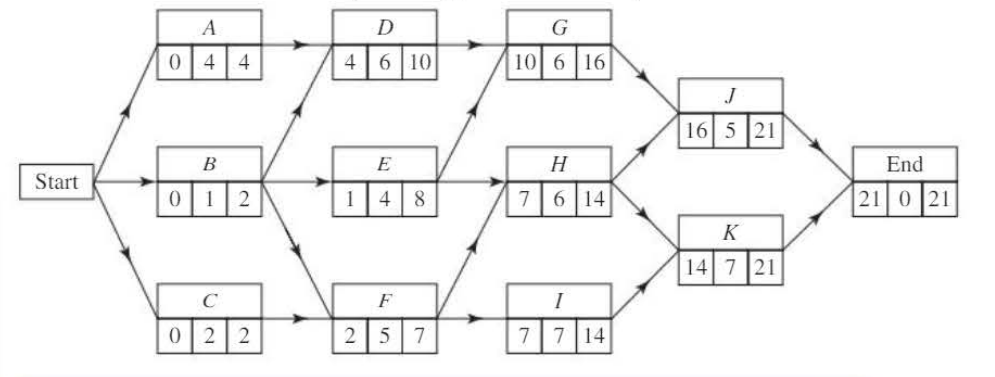
Draw a Gantt chart corresponding to this activity network:
Solution:
Step 1: Create the timing table
| Activity | Duration (hours) | Start time | Finish time | Float | ||
|---|---|---|---|---|---|---|
| Earliest | Latest | Earliest | Latest | |||
| A | 4 | 0 | 0 | 4 | 4 | 0 |
| B | 1 | 0 | 1 | 1 | 2 | 1 |
| C | 2 | 0 | 0 | 2 | 2 | 0 |
| D | 6 | 4 | 4 | 10 | 10 | 0 |
| E | 4 | 1 | 4 | 5 | 8 | 3 |
| F | 5 | 2 | 2 | 7 | 7 | 0 |
| G | 6 | 10 | 10 | 16 | 16 | 0 |
| H | 6 | 7 | 8 | 13 | 14 | 1 |
| I | 7 | 7 | 7 | 14 | 14 | 0 |
| J | 5 | 16 | 16 | 21 | 21 | 0 |
| K | 7 | 14 | 14 | 21 | 21 | 0 |
Step 2: Identify critical activities
The critical activities are A, C, D, F, G, I, J, and K (all have zero float).
These form two critical paths through the network:
- Path 1: A → D → G → J
- Path 2: C → F → I → K
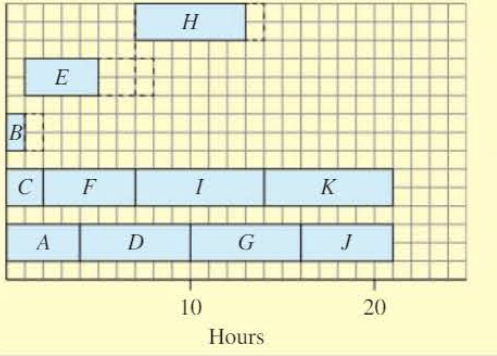
Step 3: Draw the Gantt chart
Plot the critical activities first (they have fixed positions), then add the non-critical activities showing their possible scheduling ranges.
The chart uses an upside-down layout with early activities at the top, spanning 0 to 21 hours.
Worked example 2
Worked Example: Creating a Gantt Chart from a Precedence Table
A project has the following precedence table:
| Activity | Depends on | Duration (days) |
|---|---|---|
| A | - | 8 |
| B | - | 4 |
| C | A | 10 |
| D | B | 7 |
| E | C | 2 |
| F | C, D | 6 |
| G | E, F | 3 |
Draw a Gantt chart for this project.
Solution:
Step 1: Draw the activity network
Construct the network showing all dependencies between activities. Perform forward and backward passes to find earliest start times and latest finish times.
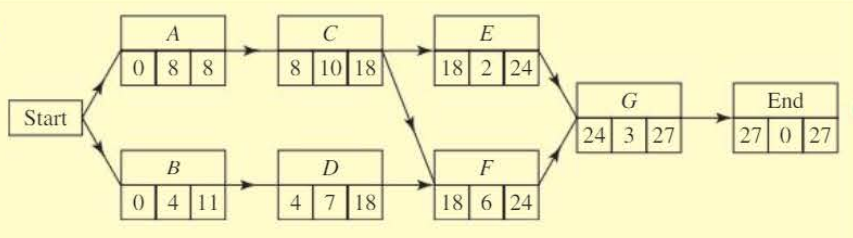
Step 2: Identify the critical activities
The critical activities are A, C, F, and G (these all have zero float).
The critical path is: A → C → F → G
The minimum project duration is 27 days.
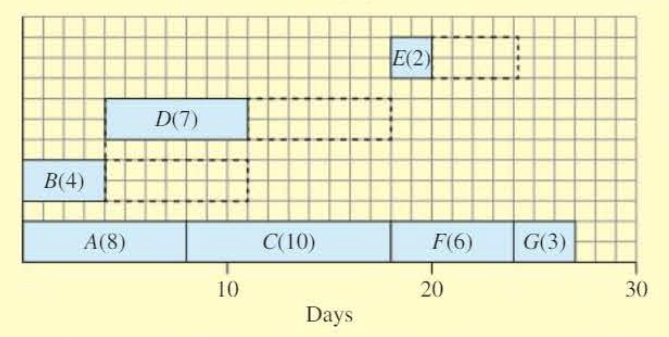
Step 3: Draw the Gantt chart
Plot critical activities A, C, F, and G at their fixed times:
- Activity A: days 0-8
- Activity C: days 8-18
- Activity F: days 18-24
- Activity G: days 24-27
Then add the non-critical activities:
- Activity B: can start at day 0, duration 4 days, latest finish day 11 (float = 7 days)
- Activity D: can start at day 4, duration 7 days, latest finish day 18 (float = 7 days)
- Activity E: can start at day 18, duration 2 days, latest finish day 24 (float = 4 days)
The chart shows the entire project timeline from day 0 to day 27.
Exam tips
Key Examination Strategies:
- Always complete the timing table first - this prevents errors and makes it easier to spot critical activities
- Check your float calculations - a common mistake is to forget to subtract the duration
- Label your axes clearly - include the time unit (hours, days, weeks)
- Make sure critical activities are clearly identified - you may be asked to list them
- Show the full range for non-critical activities - this demonstrates understanding of scheduling flexibility
- Keep your chart neat and readable - use a ruler and clear labels
- Remember the formulas:
- Earliest finish = Earliest start + Duration
- Latest start = Latest finish - Duration
- Float = (Latest finish - Earliest start) - Duration
Remember!
Key Points to Remember:
- A Gantt chart is a visual scheduling tool showing activities as bars against time
- Critical activities have zero float and must be completed on schedule to avoid project delays
- The critical path is formed by critical activities and determines the minimum project duration
- Float measures scheduling flexibility:
- Always draw critical activities first, then add non-critical activities showing their boundaries