Linear Rational Functions (AQA A-Level Further Maths): Revision Notes
Linear Rational Functions
What are linear rational functions?
A linear rational function is a function that can be written in the form:
where , , , and are constants, and both the numerator and denominator are linear expressions.
The numerator () and denominator () are both linear expressions, meaning they contain only first-degree terms (no squares, cubes, or higher powers of ).
These functions produce characteristic curves called rectangular hyperbolas which have two distinct branches separated by asymptotes. Understanding how to sketch these functions and identify their key features is essential for solving equations and inequalities involving rational expressions.
Key features of linear rational functions
When working with linear rational functions, you need to identify three main features:
Intercepts
x-intercept: The point where the curve crosses the x-axis (where )
- Set and solve for
- This occurs when the numerator equals zero
y-intercept: The point where the curve crosses the y-axis (where )
- Substitute into the function
- Simplify to find the y-coordinate
Asymptotes
Asymptotes are lines that the curve approaches but never touches or crosses. They act as invisible boundaries that guide the shape of the hyperbola.
Vertical asymptote: A vertical line that the curve approaches but never touches
- Occurs where the denominator equals zero
- For , set and solve for
- The curve tends to or as it approaches this line from either side
Horizontal asymptote: A horizontal line that the curve approaches as becomes very large
- Rearrange the equation to make the subject:
- Set the denominator equal to zero and solve for
- Alternatively, consider the behavior as
Behavior at infinity
As becomes very large (positive or negative), the curve approaches the horizontal asymptote.
You can test this by substituting large values like or to determine which side of the asymptote the curve approaches from. This helps you understand the curve's end behavior and ensures your sketch is accurate.
Sketching linear rational functions
Follow these steps to sketch a linear rational function:
- Find the intercepts by substituting and
- Find the vertical asymptote by setting the denominator equal to zero
- Find the horizontal asymptote by rearranging to and setting its denominator to zero
- Test values near the asymptotes to determine which side of the asymptote the curve lies
- Draw the asymptotes as dashed lines
- Sketch the curve through the intercepts, approaching the asymptotes
- Verify your sketch using a graphical calculator
The order of these steps is important. Finding the asymptotes first gives you the framework within which the curve must lie, making it easier to sketch accurately.
Worked examples
Worked Example 1: Basic rational function
Find the key features and sketch the graph of
Solution:
Step 1: Find the intercepts
When :
So the y-intercept is (0, -1/4)
When :
The numerator must equal zero, so , giving
The x-intercept is (-1, 0)
Step 2: Find the vertical asymptote
Set the denominator equal to zero:
The vertical asymptote is the line x = 4
Step 3: Find the horizontal asymptote
Rearrange to make the subject:
Set the denominator equal to zero:
The horizontal asymptote is the line y = 1
Step 4: Test behavior near asymptotes
When (large positive value):
The curve approaches from above as
When (large negative value):
The curve approaches from below as
Step 5: Sketch the curve
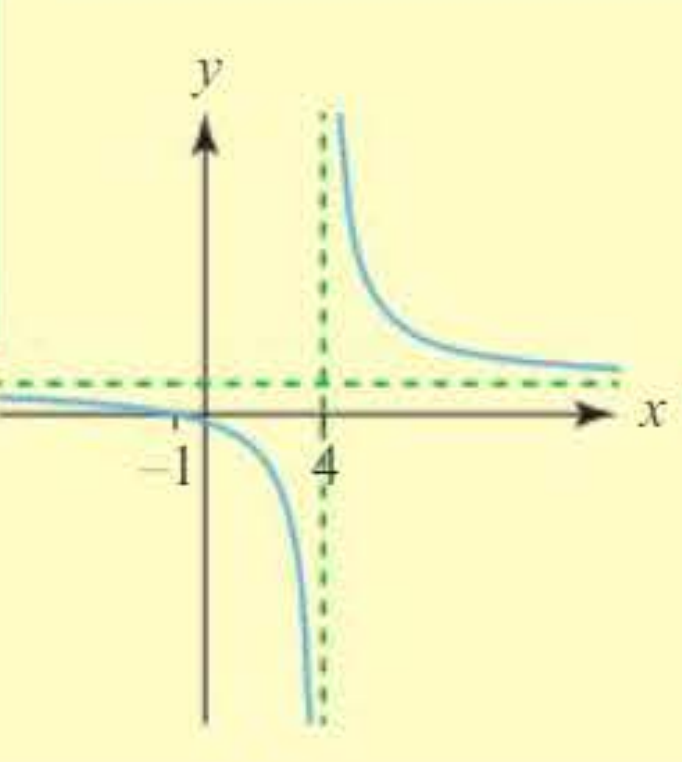
The curve has two branches: one passing through and on the left side of the vertical asymptote, approaching from below as decreases. The other branch is on the right side of , approaching from above as increases.
Worked Example 2: Function with algebraic constant
Find the key features and sketch the graph of where
Solution:
Intercepts:
When :
y-intercept: (0, -a/2)
When :
x-intercept: (-a, 0)
Vertical asymptote:
Set denominator to zero:
Horizontal asymptote:
As becomes very large:
When :
Since , this gives , so the curve approaches from above.
When :
Since is positive but much smaller than 1000, this gives , so the curve approaches from below.
Horizontal asymptote: y = 1
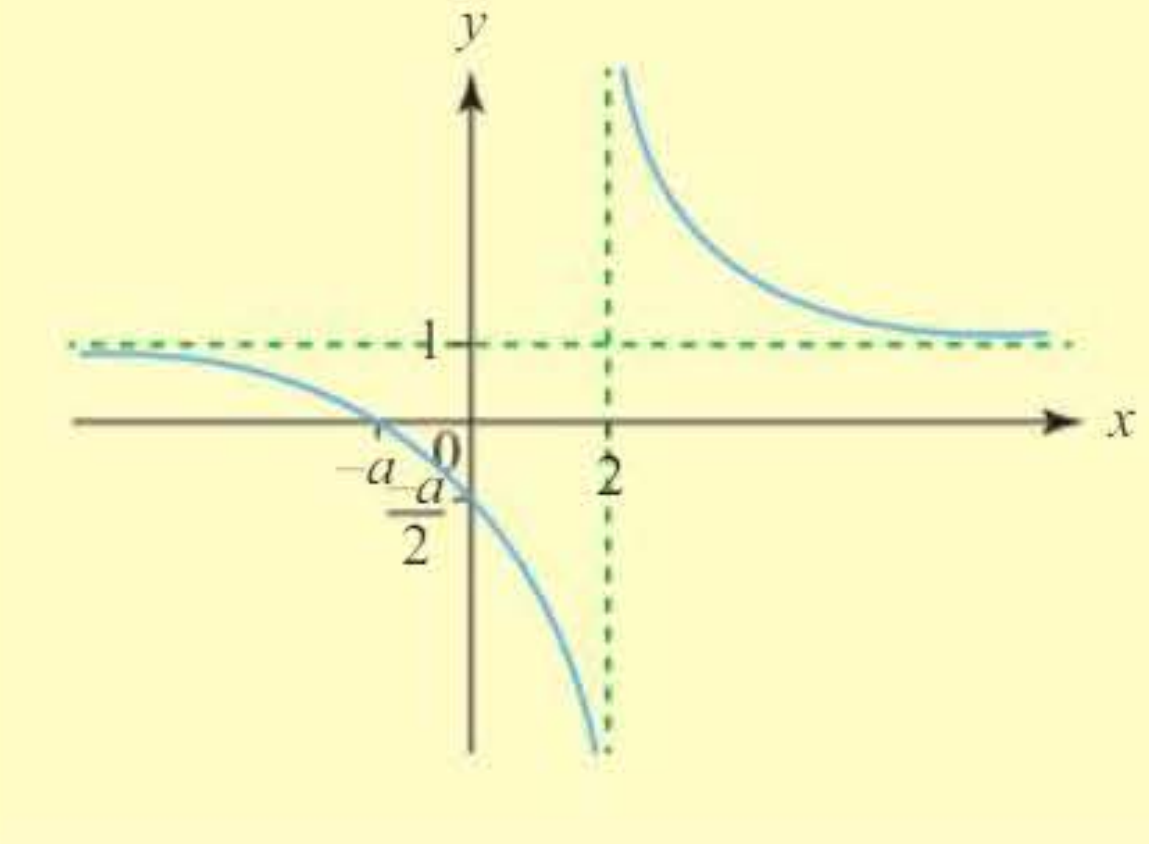
The sketch shows a hyperbola with the intercepts labeled in terms of , with the vertical asymptote at and horizontal asymptote at .
Worked Example 3: Finding intersections with a linear function
a) Identify the key features and sketch the graphs of and
b) Find the points of intersection
Solution:
Part a:
For :
When : (both intercepts at origin)
When :
Vertical asymptote: (denominator zero)
Horizontal asymptote: Rearranging gives , so , thus
Setting denominator to zero: y = 1
For the linear function :
- Gradient:
- y-intercept:
Part b: Find intersections
Set the two functions equal:
Multiply both sides by :
Factorise:
So or
When :
When :
The points of intersection are (4, -4) and (6, 6)
Solving inequalities graphically
When solving inequalities involving rational functions, a graphical approach is often the most efficient method. This is particularly useful when the algebraic approach becomes complicated.
Strategy for solving inequalities graphically
Step 1: Investigate the key features to find the shape of the graphs
- Find intercepts and asymptotes for both functions
- Determine the general shape of each curve
Step 2: Sketch the graphs and find the points of intersection
- Draw both functions on the same axes
- Solve the equation where the functions are equal to find intersection points
Step 3: Use the graphs to write down the ranges that solve the inequality
- Identify where one graph is above or below the other
- Write the solution as intervals of values
Worked Example 4: Solving a rational inequality
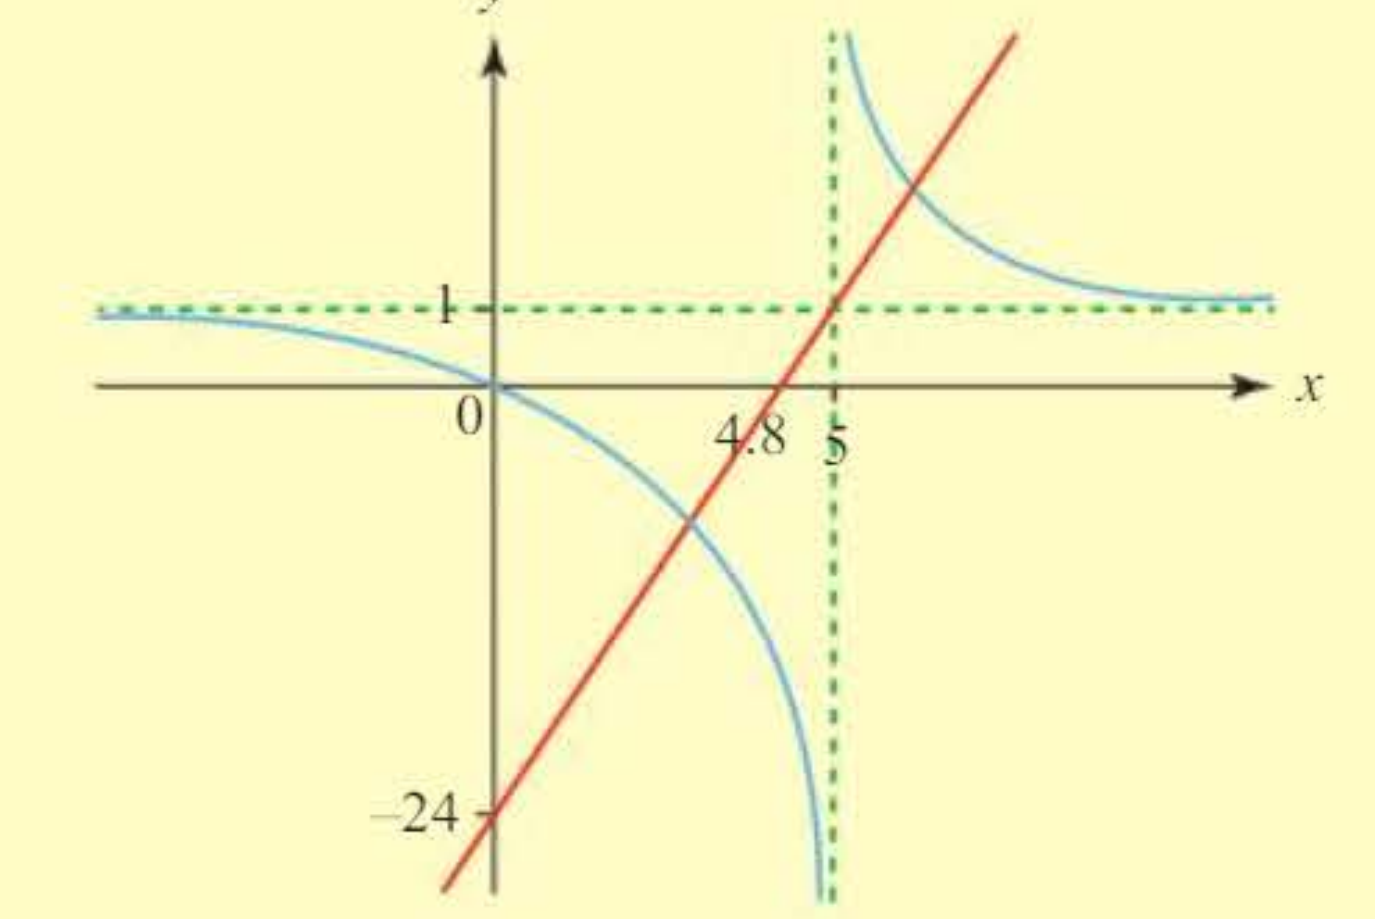
Solve the inequality graphically
Solution:
Step 1: Investigate key features
For :
- Vertical asymptote:
- When : , so (x-intercept: )
- When : (y-intercept: )
- Horizontal asymptote: As ,
For :
- This is a straight line with gradient and y-intercept
Step 2: Sketch and find intersections
Setting the functions equal:
So or
When : , giving point
When : , giving point
Step 3: Determine solution
The inequality is satisfied where the rational function (curve) is above the straight line.
From the graph, this occurs when:
Note that is excluded because it makes the denominator zero.
Worked Example 5: Comparing two rational functions
Following an experiment, student A's results fit the graph of , whilst student B's results fit
a) Find the point of intersection of their graphs
b) Find the range of values of where student A gives higher results than student B
Solution:
Part a:
Rewrite the equations:
At the point of intersection:
Cross-multiply:
When :
The point of intersection is (13, 0.2)
Part b:
First, investigate the key features:
For :
- Asymptotes: and
For :
- Asymptotes: and
Student A's results are higher than student B's when the blue graph is above the red graph. From the sketch, this occurs when:
Algebraic confirmation:
We need to solve
Case 1: Both denominators positive or both negative
If both and have the same sign:
Combined with the condition that or , this gives:
Case 2: One denominator positive and one negative
If (i.e., ):
But this contradicts , so there's no solution in this case.
Therefore, the solution is x < -2 or 3 < x < 13, confirming our graphical result.
Common exam traps and tips
Trap 1: Forgetting the vertical asymptote
When sketching rational functions, always mark the vertical asymptote with a dashed line. Remember that the function is undefined at this value, so it cannot be included in your solution to inequalities.
Trap 2: Incorrect rearrangement for horizontal asymptotes
When finding horizontal asymptotes, rearrange to make x the subject (not ), then set the denominator to zero. A common mistake is to use the wrong form.
Trap 3: Multiplying inequalities by negative quantities
When solving inequalities algebraically, remember that multiplying both sides by a negative number reverses the inequality sign. When denominators can be positive or negative, consider separate cases.
Tip 1: Verify with technology
Always check your sketches using a graphical calculator or plotting software. This helps catch errors and confirms your algebraic working.
Tip 2: Test values near asymptotes
Use large values (like or ) to determine which side of the horizontal asymptote the curve approaches from. Similarly, test values just above and below vertical asymptotes.
Tip 3: For inequalities, sketch first
Graphical methods are often quicker and less error-prone than algebraic methods for solving rational inequalities. Sketch both functions, find intersections, then read off the solution from your graph.
Tip 4: Label everything clearly
In exams, clearly label all asymptotes, intercepts, and intersection points. Use coordinates where possible. This demonstrates your understanding and helps avoid errors.
Remember!
Key Points to Remember:
- Vertical asymptotes occur where the denominator equals zero – the function is undefined at these points
- Horizontal asymptotes are found by rearranging to and setting its denominator to zero, or by considering behavior as
- To find intercepts, substitute for the y-intercept and set for the x-intercept
- When solving inequalities graphically, sketch both functions, find intersection points, then determine where one is above or below the other
- Always verify your sketches using a calculator and test values near asymptotes to confirm the curve's behavior