Chromatography and Spectroscopy (OCR A-Level Chemistry A): Revision Notes
Proton NMR Spectroscopy
Introduction to proton NMR spectroscopy
Proton nuclear magnetic resonance (¹H NMR) spectroscopy is a powerful analytical technique used to determine the structure of organic molecules. Similar to carbon-13 NMR, proton NMR examines how hydrogen nuclei in molecules absorb radiofrequency radiation in a strong magnetic field. The resulting spectrum provides detailed structural information that helps chemists identify unknown compounds and confirm molecular structures.
A proton NMR spectrum reveals four important pieces of information about a molecule:
- The number of different proton environments – determined by counting the number of peaks in the spectrum
- The types of proton environments present – identified from the chemical shift values of the peaks
- The relative numbers of each type of proton – obtained from integration traces or the ratio of peak areas
- The number of adjacent non-equivalent protons – revealed by the spin-spin splitting pattern of each peak
Chemical shifts and the TMS reference
In proton NMR, the chemical shift (symbol: ) measures how far a proton's absorption is from a reference compound. The reference standard used is tetramethylsilane (TMS), which is defined as having a chemical shift of ppm. All other chemical shifts are measured relative to this reference point.
The chemical shift range in proton NMR extends from approximately 0 to 12 ppm, which is much narrower than the carbon-13 range (which spans about 220 ppm). This narrower range means that proton NMR peaks are more closely spaced, but the technique provides additional information through splitting patterns that compensate for this limitation.
Different proton environments absorb at characteristic chemical shift values. The main categories of proton environments, in order of increasing chemical shift, are:
- = 0-1 ppm: Protons bonded to alkyl chains (HC-R groups)
- = 2-4 ppm: Protons bonded to electronegative atoms such as oxygen, nitrogen, chlorine, or bromine (e.g., HC-O, HC-N, HC-Cl), and protons in benzene rings or adjacent to C=O groups
- = 5-6 ppm: Protons bonded to carbon-carbon double bonds (HC=C) or aromatic rings
- = 7-8 ppm: Aromatic protons (protons attached directly to benzene rings)
- = 10-12 ppm: Carboxylic acid protons (COOH groups)
Additional proton environments include O-H protons (alcohols, phenols, carboxylic acids) and N-H protons (amines, amides, amino acids), which can appear at variable chemical shifts across a wide range.
You do not need to memorise these chemical shift values for your examination. A data sheet containing chemical shift information will be provided, allowing you to focus on interpreting spectra rather than memorising ranges. However, factors such as solvent choice, concentration, and substituent effects may cause peaks to appear outside these typical ranges.
Equivalent and non-equivalent protons
Understanding which protons in a molecule are equivalent is crucial for predicting and interpreting proton NMR spectra. This concept directly affects the number of peaks you will observe in a spectrum.
Defining equivalent protons
Protons are considered equivalent when they are in the same chemical environment. Equivalent protons absorb radiofrequency radiation at the same chemical shift value, which means they produce a single peak in the NMR spectrum. The size of this peak increases with the number of equivalent protons contributing to it.
Conversely, protons of different types exist in different chemical environments and are non-equivalent. These protons absorb at different chemical shift values and therefore produce separate peaks in the spectrum.
Using symmetry to identify equivalent protons
The most reliable method for identifying equivalent and non-equivalent protons is to look for planes of symmetry in the molecular structure. A plane of symmetry divides a molecule into two mirror-image halves. Protons that are mirror images of each other across a plane of symmetry are equivalent.
Let's examine two examples that illustrate this principle clearly.
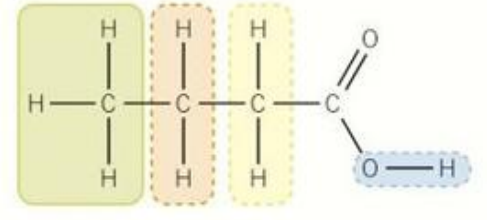
Worked Example: Butanoic acid (CH₃CH₂CH₂COOH)
In butanoic acid, the molecule has no plane of symmetry. Each CH₂ group is connected to different groups on either side, creating four distinct chemical environments. Therefore, the proton NMR spectrum shows four separate peaks, one for each different environment.
Worked Example: Butanedioic acid (HOOCCH₂CH₂COOH)
In contrast, butanedioic acid possesses a plane of symmetry running vertically through the centre of the molecule. The two CH₂ groups on either side of this plane are mirror images of each other. Each CH₂ group is connected to another CH₂ group on one side and a COOH group on the other side, meaning they exist in identical chemical environments. The four protons in the two CH₂ groups are therefore equivalent.
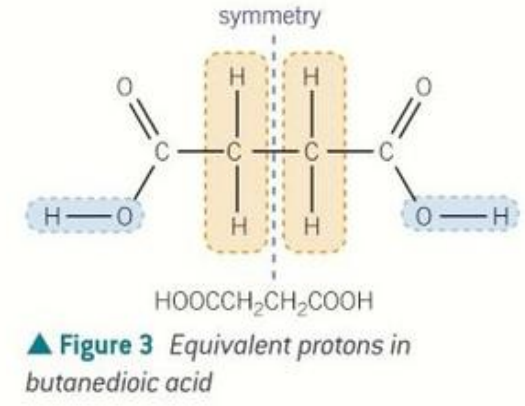
This molecule produces only two peaks in the proton NMR spectrum:
- One peak for the two equivalent COOH protons
- One peak for the four equivalent protons in the two CH₂ groups
Additionally, the peak from the four CH₂ protons will have twice the area of the peak from the two COOH protons, reflecting the 4:2 ratio of protons.
Integration and relative numbers of protons
While carbon-13 NMR peak areas are not directly proportional to the number of carbon atoms, proton NMR is different. In proton NMR, the area under each peak directly relates to the number of protons responsible for that peak.
Integration traces
The NMR spectrometer measures the area under each peak using a mathematical process called integration. The integration trace is displayed either as an additional line on the spectrum or as printed numbers showing the relative peak areas. This integration provides invaluable information for identifying unknown compounds because it reveals the ratio of different types of protons in the molecule.
The integration trace appears as a stepped line that rises at each peak. The height of each step is proportional to the area under that peak, which in turn is proportional to the number of protons causing the peak.
Worked Example: Methyl chloroethanoate
Consider the proton NMR spectrum of methyl chloroethanoate (ClCH₂COOCH₃). This molecule contains two distinct proton environments:
- Two protons in the ClCH₂ group
- Three protons in the OCH₃ group
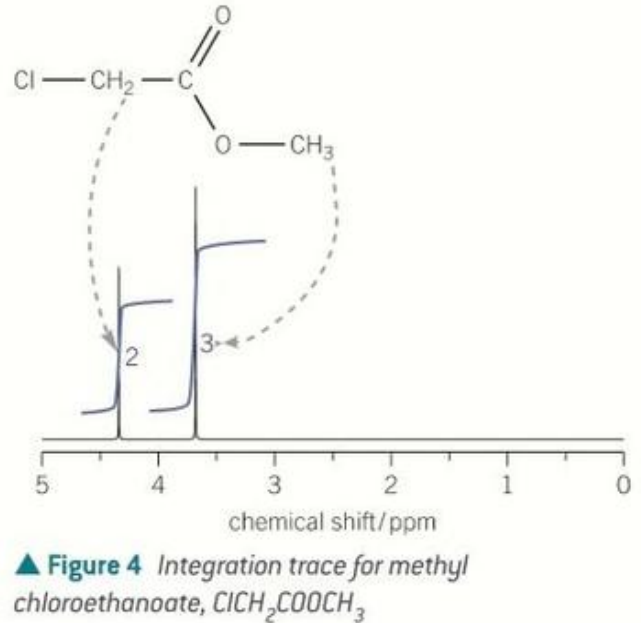
The integration trace shows a ratio of 2:3 for these two peaks, matching the actual number of protons in each environment. In an exam question, you might see integration values written directly on the spectrum or displayed as a stepped trace line.
When analysing integration data, remember that the absolute numbers are less important than the ratio between peaks. Integration values of 2.0 and 3.0 indicate the same ratio as values of 4.0 and 6.0 – both represent a 2:3 ratio. Always simplify integration ratios to their lowest whole number form.
Spin-spin coupling
So far, we have seen that proton NMR spectra provide information about the structure of molecules through peak positions and integration values. However, proton NMR offers an additional level of structural detail through a phenomenon called spin-spin coupling.
What is spin-spin coupling?
Spin-spin coupling occurs when a proton's magnetic field interacts with the magnetic fields of nearby protons in different chemical environments. This interaction causes the main NMR peak to split into multiple sub-peaks, creating a characteristic splitting pattern. These patterns provide information about the number of protons bonded to adjacent carbon atoms, revealing how different parts of the molecule are connected.
Spin-spin splitting only occurs between protons in different chemical environments. Equivalent protons do not split each other's signals. This is why understanding equivalent and non-equivalent protons (discussed earlier) is essential for interpreting splitting patterns correctly.
The n+1 rule
The number of sub-peaks in a splitting pattern follows a simple rule called the n+1 rule:
For a proton with protons attached to an adjacent carbon atom, the number of sub-peaks in the splitting pattern =
When analysing spin-spin splitting, you are determining the number of hydrogen atoms on the immediately adjacent carbon atom. The adjacent carbon is the one directly next to the carbon bearing the protons you are examining.
Common splitting patterns
The table below shows the splitting patterns you will encounter most frequently in proton NMR spectra:
| n | n+1 | Splitting pattern | Relative peak areas | Structural feature |
|---|---|---|---|---|
| 0 | 1 | singlet | 1 | no H on adjacent atoms |
| 1 | 2 | doublet | 1:1 | adjacent CH |
| 2 | 3 | triplet | 1:2:1 | adjacent CH₂ |
| 3 | 4 | quartet | 1:3:3:1 | adjacent CH₃ |
These patterns are very common in NMR spectra. The relative peak areas within each splitting pattern follow a mathematical sequence called Pascal's triangle. As the number of adjacent protons increases, the degree of splitting continues beyond what is shown here. For example, a CH proton adjacent to six protons (such as in CH(CH₃)₂) produces a heptet (seven-peak pattern) with relative areas of 1:6:15:20:15:6:1.
Aromatic protons
Aromatic protons (those attached to benzene rings) are expected to absorb in the range ppm. Splitting does occur for aromatic protons, but the patterns can be very complex and difficult to interpret due to the multiple interactions possible around the ring. For A-Level examination purposes, you are only expected to recognise aromatic protons as groups of protons that often form one or more multiplets (complex overlapping patterns) in this chemical shift range.
Splitting patterns occur in pairs
An important principle to understand is that splitting patterns always occur in pairs in an NMR spectrum. If you observe one splitting pattern, there must be another pattern elsewhere in the spectrum. This occurs because each proton splits the signal of neighbouring protons, and those neighbouring protons split the original proton's signal in return.
This pairing makes structural analysis easier. Several very common splitting combinations appear repeatedly in spectra, and learning to recognise these will speed up your analysis considerably. While you can work out any splitting pattern using the n+1 rule, you will quickly learn to recognise the triplet/quartet combination that indicates a CH₃CH₂ unit because it appears so frequently in organic molecules.
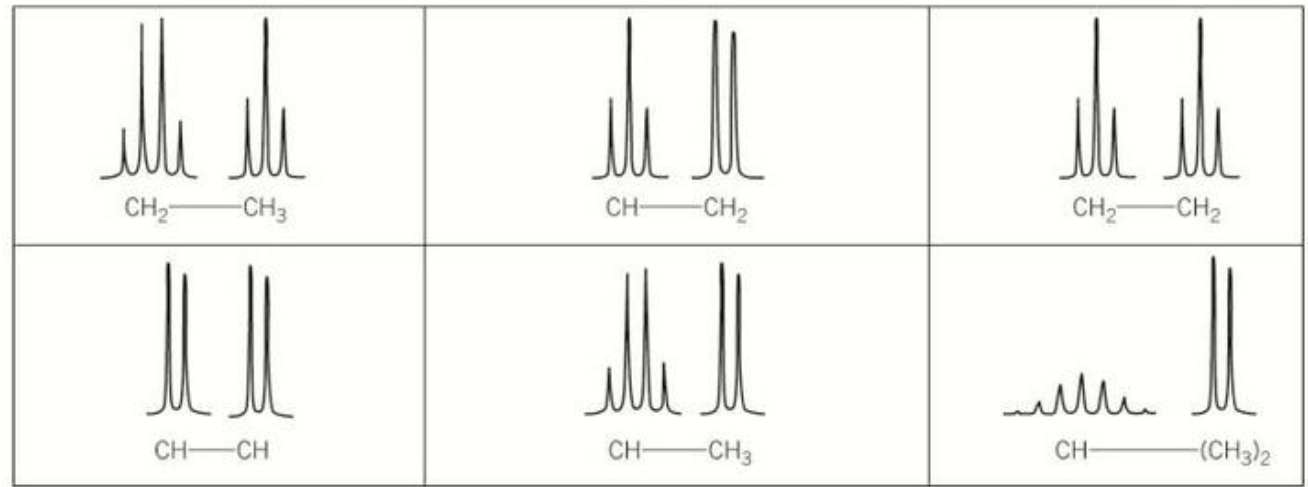
Common splitting pairs include:
- CH₂-CH₃: quartet and triplet
- CH-CH₂: triplet and doublet
- CH₂-CH₂: triplet and triplet (when in different environments)
- CH-CH: doublet and doublet
- CH-CH₃: quartet and doublet
- CH-(CH₃)₂: septet and doublet
Hydroxyl and amino protons
Organic compounds frequently contain protons that are not bonded to carbon atoms. The most common examples are hydroxyl (OH) protons and amino (NH) protons.
Functional groups containing OH and NH protons
These protons appear in several important functional groups:
- Alcohols (ROH)
- Phenols (ArOH)
- Carboxylic acids (RCOOH)
- Amines (RNH₂)
- Amides (RCONH₂)
- Amino acids (RCH(NH₂)COOH)
Characteristics of OH and NH peaks
In solution, OH and NH protons frequently participate in hydrogen bonding with other molecules. This hydrogen bonding causes the NMR peaks for these protons to be broad rather than sharp, and their chemical shifts can vary considerably depending on concentration, solvent, and temperature.
The chemical shift ranges shown in data sheets indicate that OH and NH peaks can occur at almost any chemical shift value, though carboxylic acid COOH protons are more predictable and typically absorb at ppm.
The broadening of OH and NH peaks has an important consequence: these protons are usually not involved in spin-spin coupling. The broad nature of their peaks means they do not show splitting patterns, and they typically do not split the signals of adjacent CH protons either. This can make assigning OH and NH protons in a spectrum quite challenging.
Proton exchange with deuterium oxide
Chemists have developed a clever technique to identify OH and NH protons unambiguously. This method, called proton exchange, involves the following steps:
- A proton NMR spectrum is recorded as normal
- A small volume of deuterium oxide (D₂O, also called heavy water) is added to the sample, the mixture is shaken, and a second spectrum is recorded
Deuterium is an isotope of hydrogen with one proton and one neutron in its nucleus. When D₂O is added to the sample, the OH and NH protons exchange with deuterium atoms according to equilibria such as:
Since deuterium does not absorb in the chemical shift range used for proton NMR, the peaks from OH and NH protons disappear in the second spectrum. By comparing the two spectra, you can definitively identify which peaks correspond to exchangeable OH and NH protons.
Worked Example: Identifying OH protons in methanol
In the NMR spectrum of methanol (CH₃OH), you will observe a broad OH peak and a sharp CH₃ peak.
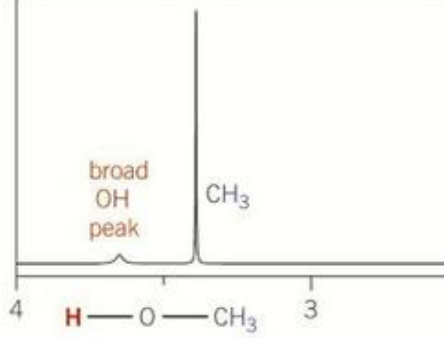
After adding D₂O and recording a second spectrum, the OH peak disappears, leaving only the methyl peak. This confirms the identity of the OH proton peak.
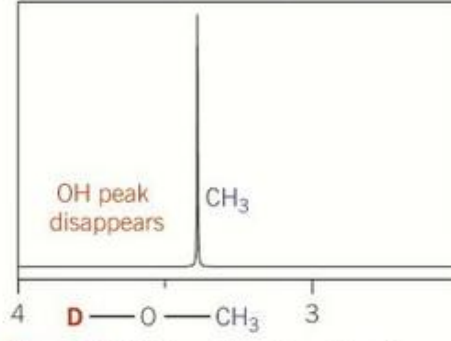
The disappearance of the OH peak occurs because the OH proton has been replaced with a deuterium atom (OD), which does not appear in the proton NMR spectrum.
Key Points to Remember:
-
Proton NMR provides four pieces of information: number of environments (from number of peaks), types of environments (from chemical shifts), relative numbers of protons (from integration), and connectivity (from splitting patterns)
-
Chemical shift values are measured relative to TMS at ppm and range from approximately 0-12 ppm. You will be provided with chemical shift data in examinations
-
Equivalent protons are in the same chemical environment and absorb at the same chemical shift. Look for planes of symmetry to identify equivalent protons in molecules
-
Integration traces or peak area ratios reveal the relative numbers of protons in different environments. Simplify integration ratios to their lowest whole number form
-
The n+1 rule predicts splitting patterns: a proton with adjacent protons shows peaks. Splitting only occurs between non-equivalent protons on adjacent carbon atoms
-
Common patterns include singlet (no adjacent H), doublet (one adjacent H), triplet (two adjacent H), and quartet (three adjacent H). Recognise the triplet-quartet pair for CH₃CH₂ groups
-
OH and NH protons produce broad, variable peaks and usually don't participate in spin-spin coupling. Use D₂O exchange to identify these peaks – they will disappear in the second spectrum