Combined Techniques (OCR A-Level Chemistry A): Revision Notes
Combined Techniques
Introduction to structure determination
In organic chemistry, identifying the structure of an unknown compound requires combining information from multiple analytical techniques. No single method provides enough information on its own, so chemists use a systematic approach that brings together data from different sources.
The key to successful structure determination is using complementary techniques - each method provides different information that, when combined, reveals the complete molecular structure.
The main analytical techniques used for structure determination are:
- Elemental analysis - determines the empirical formula
- Mass spectrometry - identifies the molecular mass and molecular formula
- Infrared (IR) spectroscopy - identifies functional groups present
- Nuclear magnetic resonance (NMR) spectroscopy - reveals the arrangement of carbon and hydrogen atoms
The systematic approach to structure determination
Structure determination follows a logical sequence where each technique provides specific information that builds toward the complete structure. Working through these techniques in order ensures you gather all necessary information before proposing a final structure.
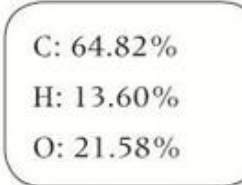
Step 1: Elemental analysis
Elemental analysis provides the percentage composition by mass of each element in the compound. This data allows you to calculate the empirical formula - the simplest whole number ratio of atoms in the compound.
How to calculate the empirical formula:
- Convert each percentage to moles by dividing by the relative atomic mass
- Divide all mole values by the smallest number to find the simplest ratio
- If necessary, multiply all ratios by a small whole number to remove decimals
Worked Example: Calculating Empirical Formula
If elemental analysis gives C: 73.17%, H: 7.32%, O: 19.51%:
Step 1: Convert percentages to moles
Step 2: Divide by the smallest value (1.22)
Step 3: Write the empirical formula
Therefore, the empirical formula is C₅H₆O
Step 2: Mass spectrometry
The mass spectrum shows the molecular ion peak ( peak), which appears at the highest m/z value. This peak corresponds to the molecular mass of the compound and is essential for determining the molecular formula.
Finding the molecular formula:
- Calculate the relative mass of the empirical formula
- Divide the molecular mass by the empirical formula mass
- Multiply the empirical formula by this number
Worked Example: Finding Molecular Formula
Continuing the example above, if the molecular ion peak is at m/z = 164:
Step 1: Calculate empirical formula mass
Step 2: Find the multiplier
Step 3: Calculate molecular formula
Exam Tip: The molecular ion peak is usually the peak with the highest m/z value, though it may not always be the tallest peak in the spectrum. Don't confuse the tallest peak with the molecular ion peak!
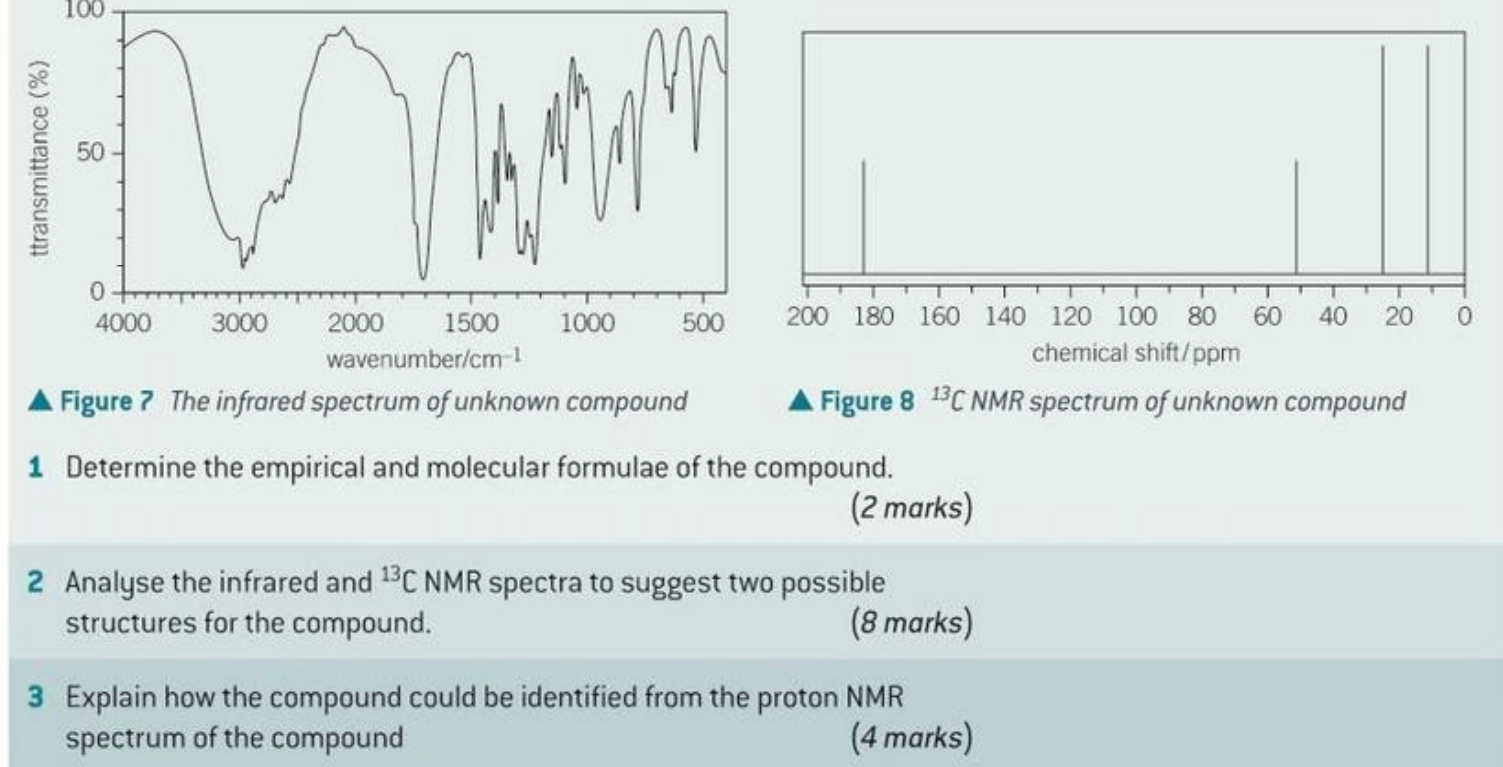
Step 3: Infrared (IR) spectroscopy
The IR spectrum identifies functional groups by showing characteristic absorption peaks at specific wavenumbers. You should use the data sheet provided in the exam to interpret IR spectra.
Always refer to your data sheet for IR wavenumbers. You don't need to memorize exact values, but you should recognize the key functional groups and their approximate positions.
Key functional group absorptions:
- (carbonyl) group: strong absorption around 1710 cm⁻¹
- (alcohol): broad absorption 3200-3600 cm⁻¹
- (carboxylic acid): very broad absorption 2500-3300 cm⁻¹
- (aromatic): absorption around 3000-3100 cm⁻¹
In the example, a peak at 1710 cm⁻¹ indicates a group in an aldehyde, ketone, or ester. The absence of a broad peak at 2500-3300 cm⁻¹ rules out a carboxylic acid.
Step 4: Carbon-13 NMR spectroscopy
The NMR spectrum shows the number of different carbon environments in the molecule. Each peak represents carbons in a unique chemical environment.
Important Points:
- The number of peaks = number of different carbon environments
- Symmetry in the molecule reduces the number of peaks
- Chemical shift values (in ppm) indicate the type of carbon environment
In the worked example, eight peaks indicate eight different carbon environments, matching the eight carbons in the molecular formula .

Step 5: Proton NMR spectroscopy
The NMR (proton NMR) spectrum provides three key pieces of information that help determine the hydrogen arrangement in your molecule.
1. Number of peaks = number of different proton environments
2. Integration (relative peak areas) = ratio of protons in each environment
In the example, the peak areas give a ratio of 4 : 3 : 2 : 3, showing:
- 4 protons in one environment
- 3 protons in another environment
- 2 protons in a third environment
- 3 protons in a fourth environment
3. Splitting patterns = information about adjacent protons
The n+1 rule states that a proton with n adjacent protons will split into (n+1) peaks:
- n = 0 → singlet (1 peak)
- n = 1 → doublet (2 peaks)
- n = 2 → triplet (3 peaks)
- n = 3 → quartet (4 peaks)
Interpreting chemical shifts:
Different proton environments appear at characteristic chemical shift values:
- = 6.9-8.0 ppm: aromatic protons ()
- = 3.8 ppm: protons in next to oxygen ()
- = 2.6 ppm: protons in next to carbonyl () or aromatic ring ()
- = 1.2 ppm: protons in next to carbon ()
Worked Example: Analysing Splitting Patterns
From the spectrum:
- 6.9-8.0 ppm: 4 aromatic protons (appears as two doublets in 1,4-disubstituted benzene)
- 3.8 ppm: group (singlet, no adjacent H) → O-CH₃
- 2.6 ppm: group (quartet, 3 adjacent H) → CH₂ next to CH₃
- 1.2 ppm: group (triplet, 2 adjacent H) → CH₃ next to CH₂
The triplet at 1.2 ppm and quartet at 2.6 ppm indicate a group.
Study Tip: The splitting pattern of aromatic protons depends on the substitution pattern. In 1,4-disubstituted benzene rings, aromatic protons often appear as two doublets because protons at positions 2 and 6 are equivalent, as are protons at positions 3 and 5.
Step 6: Combining all information
The final step is to piece together all the information to propose a structure that fits all the data from every technique. This requires careful analysis and logical deduction.
Worked Example: Determining the Final Structure
For the worked example:
- Molecular formula:
- Functional group from IR: (ester, ketone, or aldehyde)
- Eight carbon environments from NMR
- Proton NMR shows: aromatic ring, group, group
The NMR suggests a 1,4-disubstituted aromatic ring (due to symmetry). Combining a benzene ring, a group, , and leads to two possible structures:
- (methyl ester with ethyl substituent)
- (ethyl ketone with methoxy substituent)
Distinguishing between structures:
To determine which structure is correct, you could use additional proton NMR evidence. The chemical shifts and splitting patterns of the aromatic protons would differ depending on whether the ring is attached to an ethyl group or a methoxy group.
Practice questions
When tackling exam questions on combined techniques:
- Work systematically - follow the same order: empirical formula, molecular formula, functional groups, carbon environments, proton environments
- Show your working - especially for empirical and molecular formula calculations
- Use the data sheet - for IR wavenumbers and NMR chemical shifts
- Consider symmetry - this explains why the number of NMR peaks may be less than the total number of atoms
- Check your answer - does your proposed structure match ALL the data?
Common Mistakes to Avoid:
- Forgetting to divide by the smallest number when finding the empirical formula
- Misidentifying the molecular ion peak (it's usually the highest m/z, not the tallest peak)
- Ignoring splitting patterns in proton NMR
- Proposing a structure that doesn't match the molecular formula
Key Points to Remember:
- Combined techniques work together - elemental analysis → mass spec → IR → NMR follows a logical sequence where each technique provides complementary information
- Empirical formula first - convert percentages to moles, divide by the smallest, and find whole number ratios
- Molecular ion peak = molecular mass - use this with the empirical formula mass to find the molecular formula
- IR identifies functional groups - look for characteristic peaks like C=O at ~1710 cm⁻¹
- ¹³C NMR counts carbon environments - remember that symmetry reduces the number of peaks
- ¹H NMR gives three clues - number of peaks (environments), integration (ratio), and splitting (n+1 rule for adjacent protons)
- Always combine ALL the evidence - your proposed structure must fit every piece of data from all four techniques