Demand (OCR A-Level Economics): Revision Notes
2.2 Demand
DEFINITION:
- ceteris paribus: other things being equal
- effective demand: consumers have to be both willing and able to purchase the good
- joint demand: when goods or services are consumed with each other; they are compliments
- competitive demand: when goods or services compete with each other to attract consumers as they provide a similar function or characteristics that satisfy similar consumer needs and wants; they are substitutes
- composite demand: when a good is required by the consumer for different reasons (e.g. water)
- inferior goods: goods that are consumed because more desirable alternatives cannot be purchased with the income available
Explain, with the aid of a diagram:
2.2.1 The relationship between price and quantity demanded
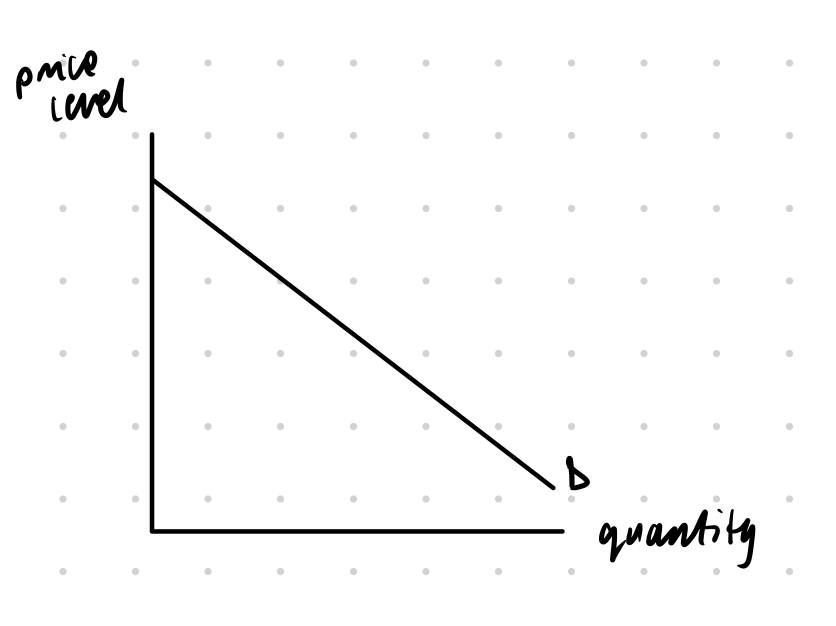
The relationship between price and quantity demanded is illustrated by the demand curve, which typically slopes downward from left to right. This negative slope indicates an inverse relationship between price and quantity demanded: as the price of a good or service decreases, the quantity demanded increases, and vice versa. This relationship is known as the law of demand.
Key Points to Explain:
Law of Demand: The law of demand states that, ceteris paribus (all other factors being constant), there is an inverse relationship between price and quantity demanded. This means that higher prices lead to a lower quantity demanded, while lower prices lead to a higher quantity demanded.
Downward Sloping Curve: The demand curve slopes downward due to:
Movement Along the Demand Curve: Changes in the price of the good itself result in a movement along the demand curve. For example:

Annotated Diagram Explanation:
In this diagram:
- The y-axis represents the price of the good or service.
- The x-axis represents the quantity demanded.
- Points (Q1, P1) and (Q2, P2) on the demand curve show how quantity demanded changes with price. At price P1, the quantity demanded is Q1. When the price decreases to P2, the quantity demanded increases to Q2.
In summary, the demand curve graphically represents the inverse relationship between price and quantity demanded, showing how consumers' purchasing behaviour changes in response to price variations.
2.2.2 Individual and Market Demand
The diagrams are the same as the previous diagram
Individual Demand:
- Definition: Individual demand refers to the quantity of a good or service that a single consumer is willing and able to purchase at various prices over a given period.
- Law of Demand: The law of demand states that, ceteris paribus (all other factors being equal), as the price of a good falls, the quantity demanded by an individual increases, and as the price rises, the quantity demanded decreases. This is due to the substitution and income effects.
Market Demand:
- Definition: Market demand is the total quantity of a good or service that all consumers in a market are willing and able to purchase at various prices over a given period. It is the horizontal summation of all individual demand curves.
- Law of Market Demand: Like individual demand, market demand follows the law of demand, where a decrease in price leads to an increase in quantity demanded, and an increase in price leads to a decrease in quantity demanded.
Diagram Explanation:
- Individual Demand Curve: This curve shows the relationship between the price of a good and the quantity demanded by an individual. It typically slopes downward from left to right, reflecting the inverse relationship between price and quantity demanded.
- Market Demand Curve: This curve is derived by summing up the quantities demanded by all individuals in the market at each price level. It also slopes downward from left to right but represents the total quantity demanded by the market as a whole.
2.2.3 Explanation of Joint, Competitive, and Composite Demand
Joint Demand
Definition: Joint demand occurs when two or more goods are used together to satisfy a particular need or want. They are complementary goods.
Example: Printers and ink cartridges. If the demand for printers increases, the demand for ink cartridges also increases.
Diagram:
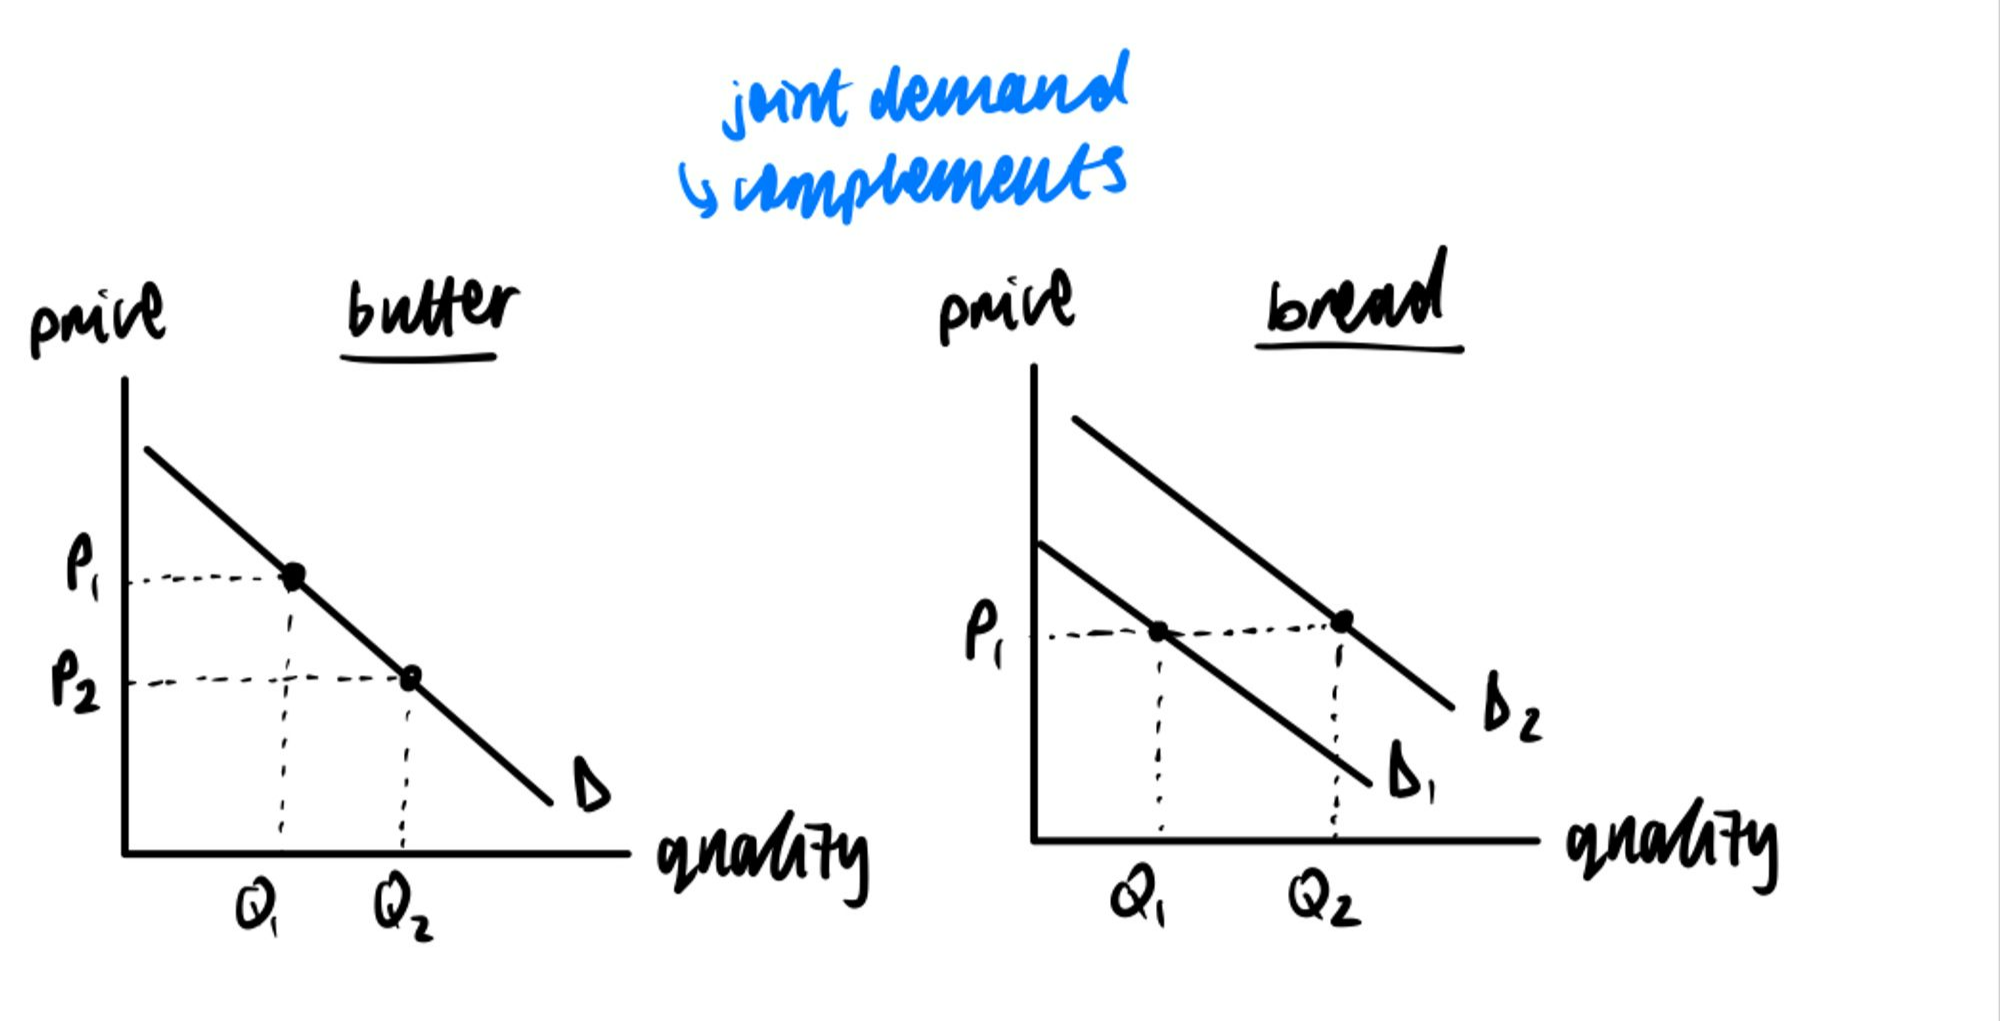
- D1 to D2: An increase in the demand for butter leads to an increase in the demand for bread, shifting the demand curve for ink cartridges from D1 to D2.
Competitive Demand
Definition: Competitive demand occurs when goods are substitutes for each other. An increase in the price of one good will increase the demand for its substitute.
Example: Tea and coffee. If the price of tea rises, consumers might switch to coffee, increasing the demand for coffee.
Diagram:
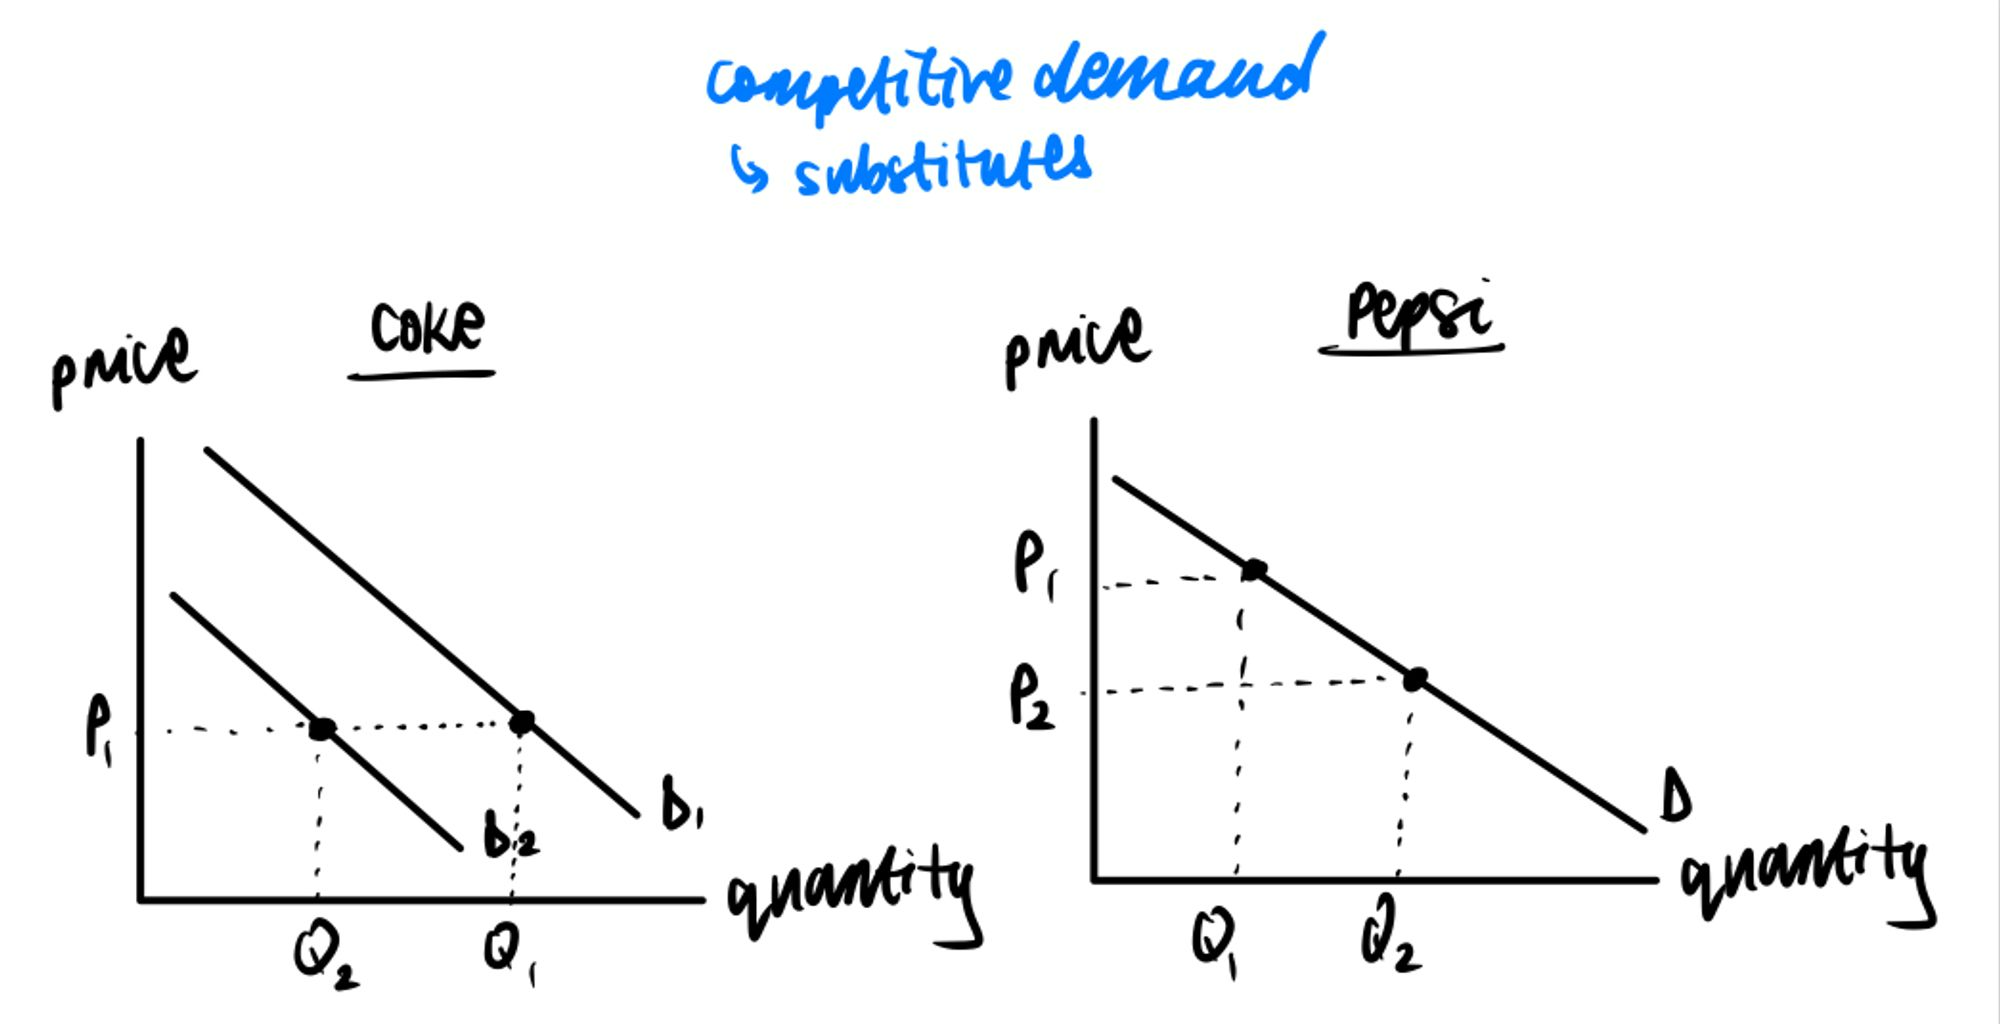
- D1 to D2: A decrease in the price of Pepsi leads to a fall in the demand for Coke, shifting the demand curve for coffee from D1 to D2.
Composite Demand
Definition: Composite demand occurs when a good is demanded for multiple purposes. An increase in demand for one purpose can affect the availability and price of the good for other purposes.
Example: Milk is used for drinking, making cheese, butter, and other dairy products. If the demand for cheese increases, it can affect the supply and price of milk for other uses.
Summary
Each diagram illustrates a rightward shift in the demand curve (D) due to the factors influencing joint, competitive, and composite demand.
By understanding these concepts, we can better grasp how the market dynamics of complementary goods, substitutes, and multi-purpose goods affect overall demand and supply.
2.2.4 Explanation of Movements Along the Demand Curve
Movements along the demand curve occur due to changes in the price of the good or service, while all other factors remain constant (ceteris paribus). These movements can be either an extension or a contraction of demand.
Extension of Demand:
Contraction of Demand:
Diagram:
Below is a simplified diagram of the demand curve, illustrating movements along the curve.
Key Points in the Diagram:
- Demand Curve (D): The demand curve is downward-sloping, indicating the inverse relationship between price and quantity demanded.
- Extension of Demand: When the price decreases from P1 to P2, the quantity demanded increases from Q1 to Q2, represented by a movement down the demand curve (from point A to point B).
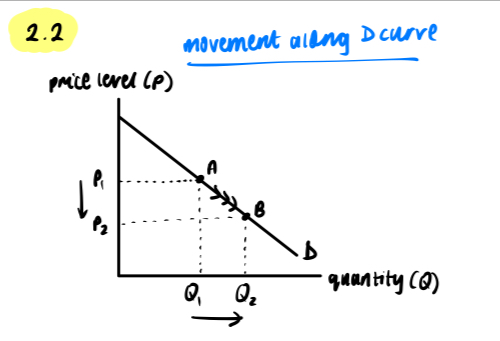
- Contraction of Demand: When the price increases from P2 to P1, the quantity demanded decreases from Q2 to Q1, represented by a movement up the demand curve (from point B to point A).
Summary:
- Extension: Lower price → Higher quantity demanded (movement down the curve).
- Contraction: Higher price → Lower quantity demanded (movement up the curve).
This analysis helps to understand consumer behaviour in response to price changes, highlighting the fundamental economic principle of the law of demand.
2.2.5 Shifts of the demand curve (increase/decrease)
In economics, shifts of the demand curve represent changes in the quantity demanded of a good or service at every price level due to factors other than the good's own price. These factors include changes in consumer income, preferences, prices of related goods, expectations, and the number of buyers.
Explanation:
Increase in Demand: This occurs when consumers are willing to purchase more of a good or service at every price level. Factors that can cause an increase in demand include:
Decrease in Demand: This occurs when consumers are willing to purchase less of a good or service at every price level. Factors that can cause a decrease in demand include:
Diagram:
Below is a simplified diagram showing shifts in the demand curve.
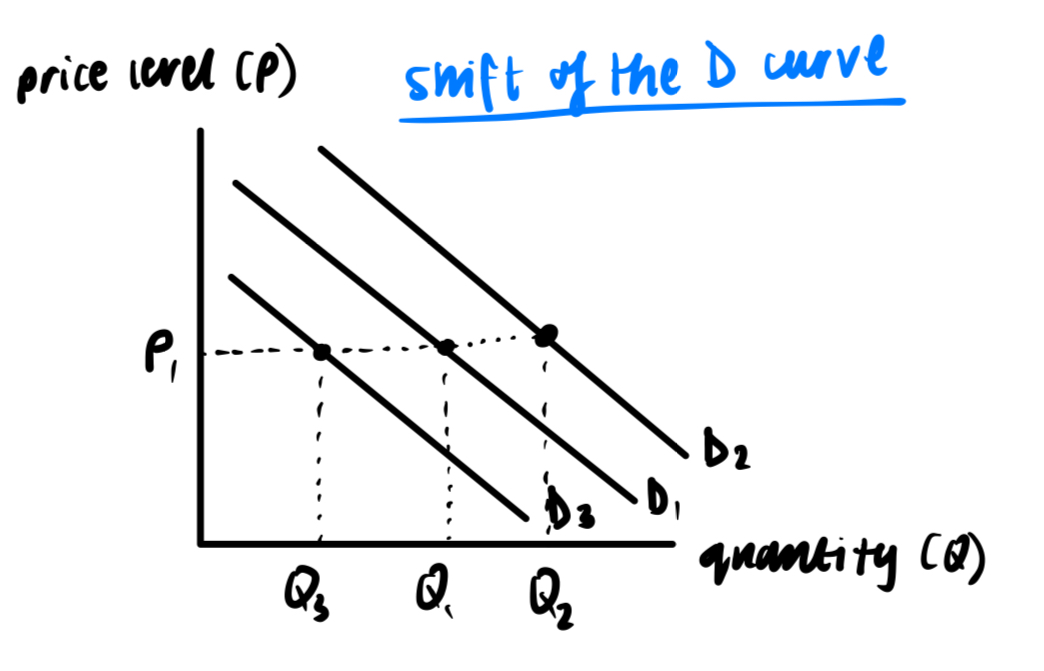
Key Points in the Diagram:
- Original Demand Curve (D1): The initial position of the demand curve.
- Shift to the Right (D2): Indicates an increase in demand. At every price level, a larger quantity is demanded.
- Shift to the Left (D3): Indicates a decrease in demand. At every price level, a smaller quantity is demanded.
Summary:
- Increase in Demand: The demand curve shifts to the right from D1 to D2.
- Decrease in Demand: The demand curve shifts to the left from D1 to D3. Shifts in the demand curve are essential to understanding how various factors influence market behaviour beyond just price changes.