Secondary Data (Leaving Cert Agricultural Science): Revision Notes
Secondary Data
Secondary data in animal production refers to information that has already been collected by researchers, government agencies, or agricultural organisations. Rather than conducting your own experiments, you analyse existing datasets to understand animal performance, feeding efficiency, and product quality. This type of data is extremely valuable for making management decisions on farms and understanding industry trends.
Understanding daily live-weight gain and feed conversion rate
Two of the most important metrics in animal production are daily live-weight gain (DLG) and feed conversion rate (FCR). These measurements help farmers assess how efficiently their animals are converting feed into body weight.
These two metrics form the foundation of performance evaluation in animal production systems. Understanding how to calculate and interpret them is essential for any livestock manager or agricultural student.
Calculating daily live-weight gain
Daily live-weight gain shows you how much weight an animal gains per day during a specific period. The formula is straightforward:
This calculation gives you the average daily weight increase, which is crucial for monitoring animal health and growth performance. Higher DLG values typically indicate good nutrition and management practices.
Worked Example: Calculating Daily Live-Weight Gain
An animal starts at 450 kg and reaches 530 kg after 60 days.
Step 1: Calculate weight gain Weight gain = 530 kg - 450 kg = 80 kg
Step 2: Apply the DLG formula DLG = 80 kg ÷ 60 days = 1.33 kg/day
This represents excellent daily growth performance.
Working out feed conversion rate
Feed conversion rate measures how efficiently animals convert feed into live weight gain. The calculation is:
Remember that a lower FCR is better - this means the animal needs less feed to produce each kilogramme of weight gain. Efficient animals with low FCR values are more profitable and environmentally sustainable.
Worked Example: Calculating Feed Conversion Rate
Using the same animal from above:
- Live-weight gain = 80 kg
- Total feed intake = 426 kg dry matter
Step 1: Apply the FCR formula FCR = 426 kg ÷ 80 kg = 5.33
This means the animal required 5.33 kg of dry matter feed for every 1 kg of weight gain.
Analysing livestock growth data
When working with secondary data tables, you'll often encounter information tracking animal performance over time. Let's examine a typical dataset:
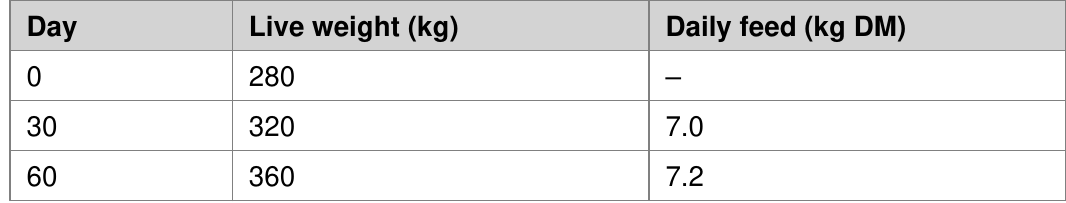
From this data, you can calculate that the animal gained 80 kg over 60 days, giving a DLG of 1.33 kg/day. With a total feed intake of 426 kg dry matter, the FCR would be 5.33. This represents strong growth performance typical of forage-based feeding systems.
Understanding milk composition variations
Dairy production data often shows how milk composition changes throughout the day. This variation affects both payment systems and processing requirements.
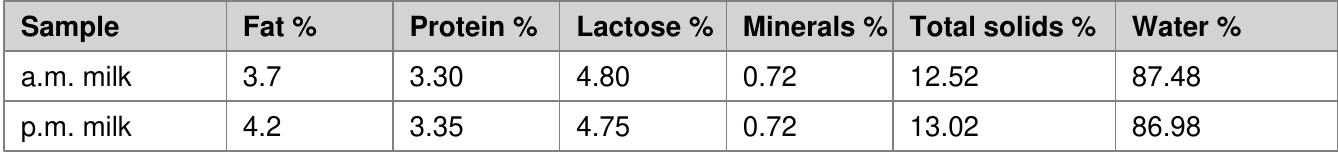
The data reveals that evening milk contains higher fat content (4.2% vs 3.7%) and total solids (13.02% vs 12.52%) compared to morning milk. This natural variation occurs because cows produce different milk composition depending on their feeding patterns and metabolic state throughout the day.
Steps for interpreting secondary data
When analysing any secondary dataset, follow these systematic steps:
- Check the time period and accuracy - Ensure you understand when data was collected and over what duration
- Confirm feed measurements - Verify whether feed is measured as fresh weight or dry matter basis
- Apply the correct formulas - Use appropriate calculations for DLG, FCR, or composition analysis
- Compare to industry benchmarks - Assess whether values are typical for the production system
- Consider confounding factors - Note any external influences like illness, diet changes, or environmental stress
Exam tips for secondary data questions
For Leaving Cert examinations, remember these key approaches:
- DLG calculation: Always divide weight gain by the number of days in the period
- FCR calculation: Divide total feed intake by total weight gain - lower values indicate better efficiency
- Milk analysis: Add solids percentages together, then subtract from 100 to find water content
- Comparison questions: Look for patterns between morning and evening samples or different time periods
- Show your working: Even if calculations seem simple, demonstrate each step clearly
Secondary data questions often test your ability to extract meaningful information from tables and apply standard industry calculations. Practice identifying the key figures needed for each formula and interpreting what your calculated results mean in practical farming terms.
Key Points to Remember:
- Secondary data analysis involves working with existing datasets rather than collecting new information
- DLG measures daily weight gain - higher values indicate better growth performance
- FCR measures feed efficiency - lower values are better and more profitable
- Evening milk typically contains more fat and total solids than morning milk
- Always follow systematic steps when interpreting data: check periods, confirm measurements, apply formulas, compare benchmarks, and consider external factors