Infrared Spectroscopy (OCR A-Level Chemistry A): Revision Notes
Infrared spectroscopy
How infrared radiation interacts with molecules
Covalent bonds connect atoms within molecules, creating a structure that is constantly in motion. These bonds possess energy and vibrate around a central equilibrium point. As temperature increases, the amount of vibration increases correspondingly. This molecular motion allows bonds to absorb infrared (IR) radiation at specific frequencies, causing them to stretch or bend more vigorously.
There are two main types of molecular vibration that occur when bonds absorb IR radiation. The first type is stretching, which involves a rhythmic movement along the line connecting two atomic centres. During this vibration, the distance between the bonded atoms increases and decreases in a periodic fashion, similar to how a spring oscillates.
The vibrating bond behaves like an oscillating spring - the bond length increases and decreases rhythmically as energy is absorbed. This simple harmonic motion helps explain why bonds absorb radiation at specific, quantized frequencies.
The second type of vibration is bending, which results in a change in the bond angle rather than the bond length. When bending occurs, the angle between bonds at an atom changes repeatedly.
Several factors determine how fast a particular bond vibrates. The mass of the atoms involved plays a crucial role - heavier atoms vibrate more slowly than lighter atoms because they have greater inertia. Additionally, the strength of the chemical bond matters significantly. Stronger bonds (such as triple bonds) vibrate at higher frequencies than weaker bonds (such as single bonds), as more energy is required to stretch or compress them.
A bond can only absorb IR radiation when the radiation's frequency matches the natural vibrational frequency of that bond. Since frequency values for molecular vibrations are very large numbers, chemists use a more convenient scale called wavenumber (measured in ). Wavenumber is directly proportional to frequency, making it easier to work with in practice. The vibrations of most chemical bonds occur in the IR wavenumber range of to .
The technique of infrared spectroscopy
Infrared spectroscopy is an analytical technique that organic chemists use extensively to identify functional groups present in organic molecules. The process involves several key steps that convert the absorption of IR radiation into useful analytical information.
The experimental procedure begins when the sample under investigation is placed inside an IR spectrometer. A beam of IR radiation spanning the range of is then passed through the sample. As the radiation passes through, the molecule absorbs some specific IR frequencies that match the natural frequencies of its bonds. The emerging beam of radiation is analysed to identify which frequencies have been absorbed by the sample.
Modern IR spectrometers are typically connected to computers that plot a graph showing transmittance (the percentage of radiation that passes through) against wavenumber. This produces the characteristic IR spectrum of the compound.

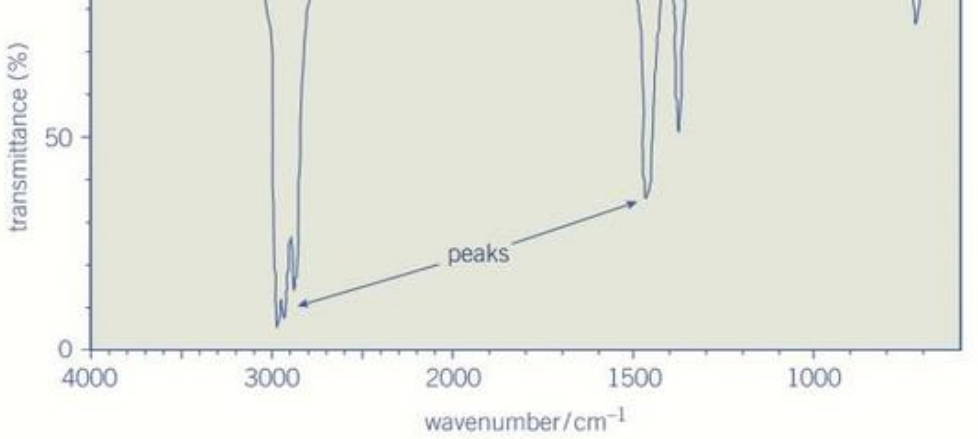
Understanding "Peaks" in IR Spectra
Although we call them peaks, they actually appear as downward dips on a transmittance graph - these dips indicate where radiation has been absorbed. Each peak corresponds to a particular bond vibrating within the molecule. Remember: lower transmittance = more absorption = a peak!
The fingerprint region
A typical IR spectrum contains a complex pattern of absorption peaks across the entire range. The region below is particularly important and is known as the fingerprint region. This section of the spectrum contains numerous unique peaks that are characteristic of the specific molecule being analysed. Just as human fingerprints are unique to each individual, the fingerprint region pattern is unique to each different molecule.
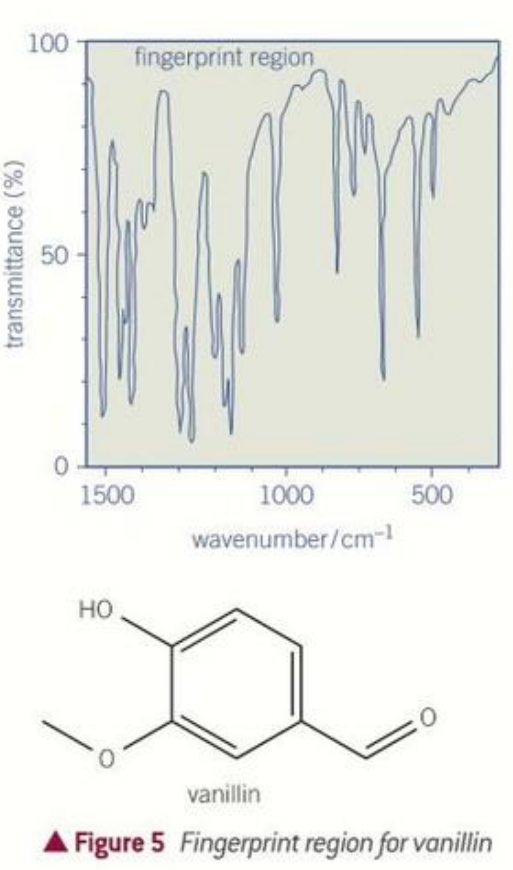
The Power of Molecular Fingerprints
The fingerprint region serves as a powerful identification tool. It can be used to identify an unknown compound either by using computer software to match against databases or by physically comparing the spectrum to booklets of published spectra. While the fingerprint region is complex and difficult to interpret in detail, it provides definitive confirmation of a molecule's identity.
Identifying functional groups using IR spectroscopy
While the fingerprint region is excellent for confirming the identity of a known compound, identifying functional groups is more straightforward when examining peaks outside this region. Chemists have studied the IR spectra of thousands of organic molecules and compiled extensive data tables that correlate specific wavenumber ranges with particular bonds and functional groups.
Key absorption peaks you need to know
The OCR specification requires you to be familiar with several important functional groups and their characteristic IR absorptions. The most critical ones for identification are:
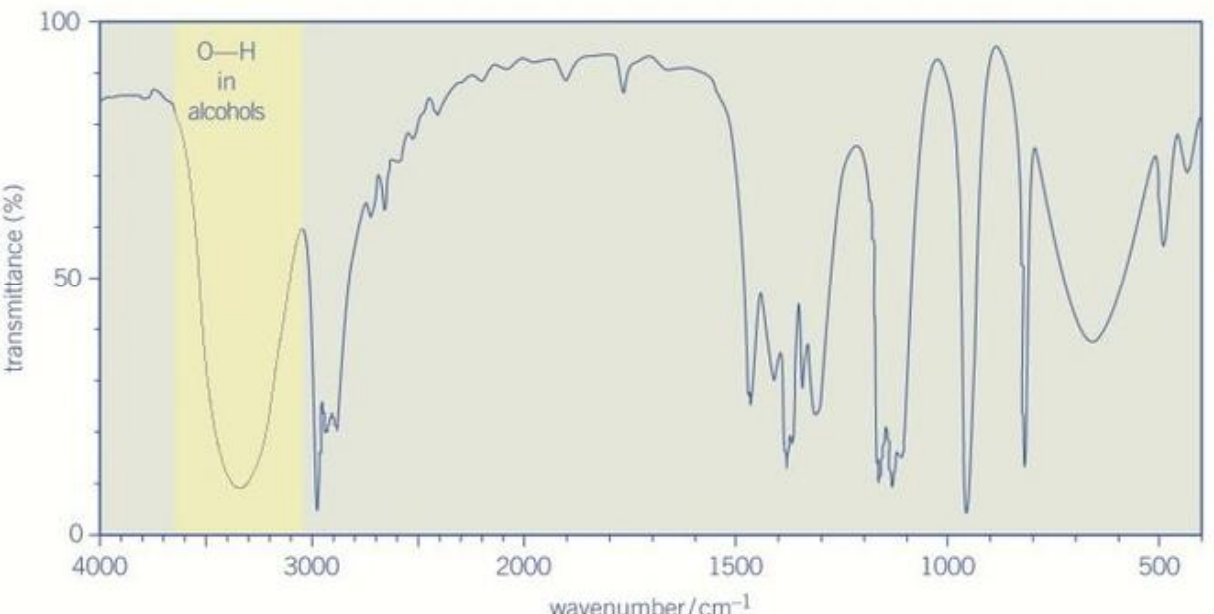
The O-H group in alcohols produces an absorption peak in the range . This peak is relatively sharp and strong, appearing at high wavenumbers. Phenols also show O-H absorption in this same range.
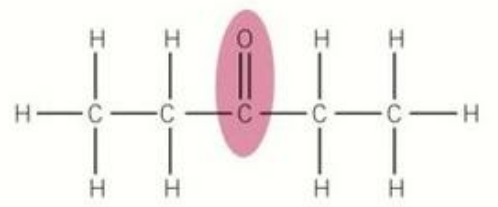
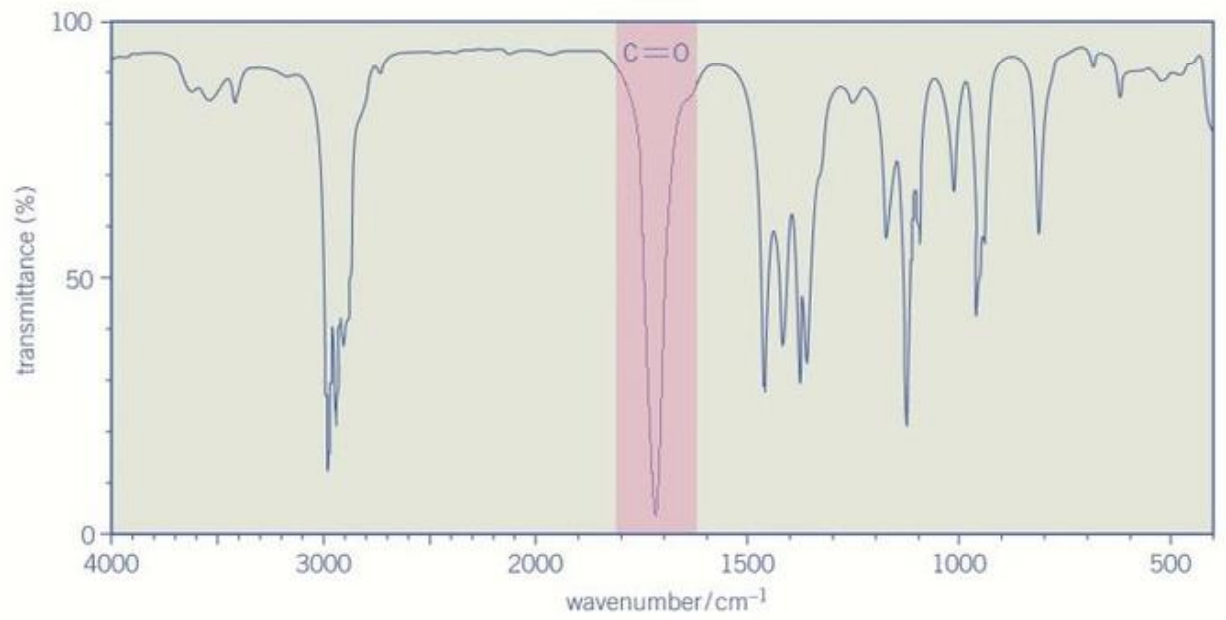
The C=O group (carbonyl group) found in aldehydes, ketones, and carboxylic acids creates a key absorption peak in the range . This peak is very strong and sharp, typically absorbing close to . The C=O peak is one of the most useful for identifying organic compounds because it is strong, clear, and appears in a relatively uncrowded region of the spectrum.
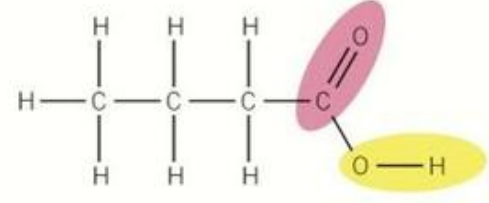
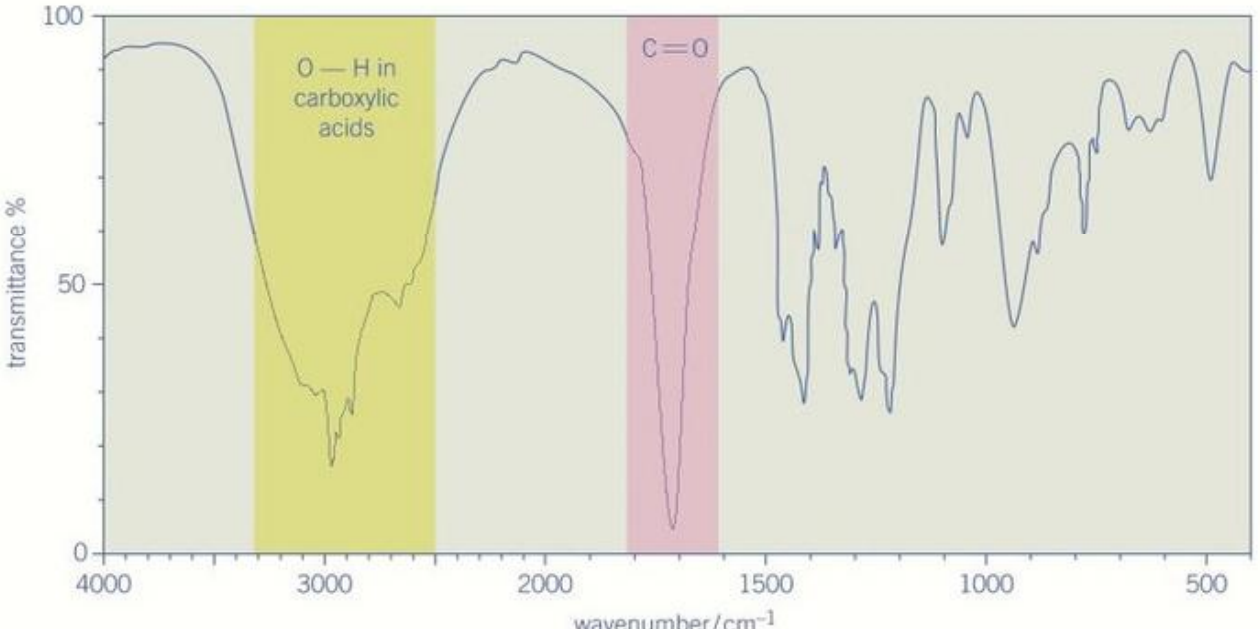
The COOH group in carboxylic acids produces two distinctive peaks that together confirm the presence of a carboxylic acid. First, there is the C=O peak around (typically near ). Second, and most characteristically, there is a very broad O-H absorption in the range . This broad O-H peak is the key identifier for carboxylic acids - it is much broader than the sharp O-H peak seen in alcohols.
There is also a C-O single bond peak in the range , but this falls in the fingerprint region and is not always reliable for identification purposes.
Critical Exam Tip: Identify Both Bond AND Functional Group
When interpreting IR spectra, it is essential to identify both the specific bond responsible for an absorption (such as C=O or O-H) AND the functional group to which it belongs (such as alcohol, ketone, or carboxylic acid).
For example, simply stating "O-H bond" is insufficient - you must specify "O-H bond in an alcohol" or "O-H bond in a carboxylic acid."
Complete IR data table for functional groups
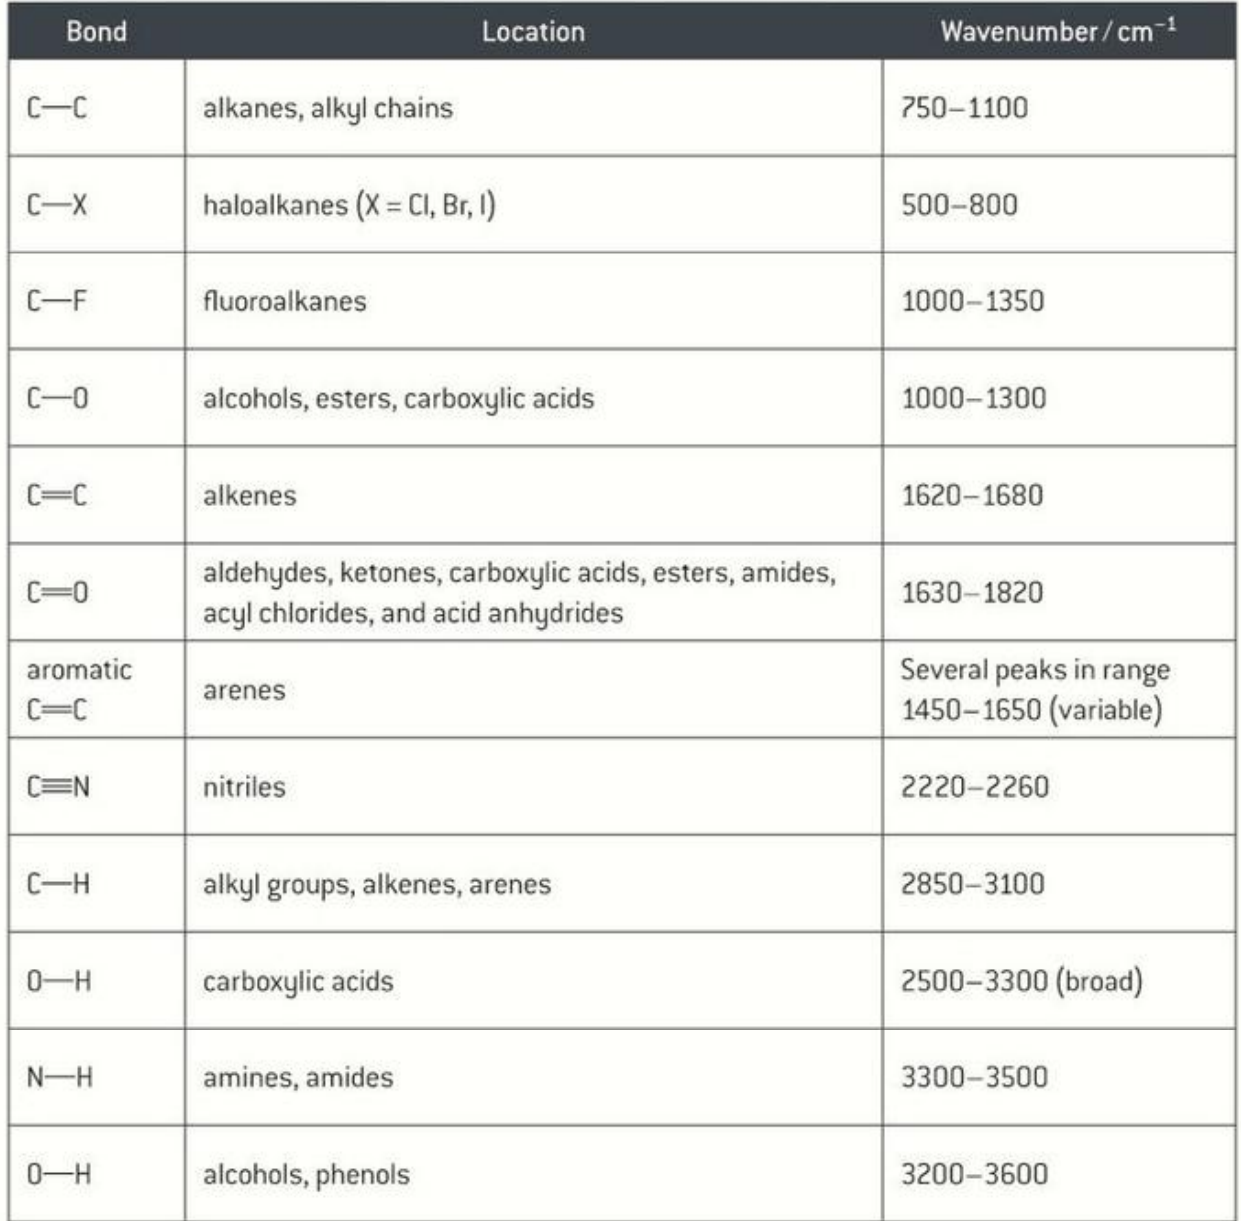
The table below shows the characteristic IR absorptions for bonds within various functional groups. You should be familiar with these ranges, particularly for the groups emphasized above.
| Bond | Location | Wavenumber / |
|---|---|---|
| C-C | alkanes, alkyl chains | 750-1100 |
| C-X | haloalkanes (X = Cl, Br, I) | 500-800 |
| C-F | fluoroalkanes | 1000-1350 |
| C-O | alcohols, esters, carboxylic acids | 1000-1300 |
| C=C | alkenes | 1620-1680 |
| C=O | aldehydes, ketones, carboxylic acids, esters, amides, acyl chlorides, acid anhydrides | 1630-1820 |
| aromatic C=C | arenes | Several peaks in range 1450-1650 (variable) |
| C≡N | nitriles | 2220-2260 |
| C-H | alkyl groups, alkenes, arenes | 2850-3100 |
| O-H | carboxylic acids | 2500-3300 (broad) |
| N-H | amines, amides | 3300-3500 |
| O-H | alcohols, phenols | 3200-3600 |
You should note that all organic compounds produce a characteristic peak between and from the presence of C-H bonds. This peak is often confused with the O-H peak in alcohols, so careful attention must be paid to the exact position and shape of absorptions in this region.
Worked examples of spectrum interpretation
Worked Example: Identifying an Alcohol
An alcohol spectrum shows an absorption peak within the range caused by the O-H bond in the alcohol functional group. There is also typically a peak between from the C-O bond, though this may be obscured by other peaks in the fingerprint region. All the other peaks visible are part of the molecule's unique fingerprint.
Key identifying feature: Sharp O-H peak at high wavenumbers ()
Worked Example: Identifying a Ketone or Aldehyde
The IR spectrum of a ketone or aldehyde displays a key sharp absorption peak within the range , caused by the C=O (carbonyl) bond. This peak typically absorbs very close to and is one of the strongest and clearest peaks in organic IR spectroscopy.
Key identifying feature: Strong, sharp C=O peak around
Worked Example: Identifying a Carboxylic Acid
The most distinctive feature of a carboxylic acid IR spectrum is the presence of TWO key peaks.
First peak: The C=O peak in the range , typically near .
Second peak: A very broad O-H absorption peak at .
When you see a C=O peak around together with a broad O-H absorption in the range , you can confidently identify the presence of a carboxylic acid group. The combination of these two peaks is diagnostic for the carboxylic acid functional group.
Key identifying features: C=O peak () + very broad O-H peak ()
Applications of infrared spectroscopy
Infrared spectroscopy has numerous practical applications beyond the chemistry laboratory, particularly in environmental monitoring and law enforcement.
Breathalysers for detecting ethanol
IR-based breathalysers are used by police to detect alcohol (ethanol) in a person's breath. The device works by passing a beam of IR radiation through the captured breath sample in a testing chamber. The characteristic bonds present in ethanol molecules absorb specific frequencies of the IR radiation. By measuring which frequencies and how much radiation is absorbed, the breathalyser can detect the presence of ethanol and quantify its concentration. The more IR radiation absorbed at ethanol's characteristic frequencies, the higher the reading and the greater the ethanol concentration in the breath.

Environmental monitoring and pollution detection
Many atmospheric pollutants can be identified and measured using their distinctive IR spectral fingerprints. Remote sensors analyse the IR spectra of vehicle emissions to detect and measure carbon monoxide (CO), carbon dioxide (CO₂), and various hydrocarbons in busy urban areas or at motorways. This technology allows for continuous monitoring of localized air pollution without requiring physical collection of air samples.
Greenhouse Gases and IR Absorption
The greenhouse gases - water vapour, carbon dioxide, and methane - also interact with IR radiation in an environmentally significant way. These gases in the atmosphere absorb longer-wavelength IR radiation that is re-emitted from the Earth's surface. This absorption matches the natural vibrational frequencies of bonds in these molecules. The vibrating bonds subsequently re-emit this energy as radiation, which increases the temperature of the lower atmosphere close to the Earth's surface, contributing to global warming.
Remember!
Key Points to Remember:
-
Molecules absorb infrared radiation when it matches the natural vibrational frequency of their bonds, causing stretching or bending vibrations
-
Wavenumber () is used as a convenient scale proportional to frequency, with most molecular vibrations occurring between
-
IR spectra plot transmittance against wavenumber, with absorption peaks appearing as downward dips
-
The fingerprint region below contains unique patterns that identify specific molecules
-
Key absorption ranges to memorize:
- O-H in alcohols: (sharp)
- C=O in carbonyls: (typically )
- O-H in carboxylic acids: (very broad)
-
Always identify both the specific bond AND the functional group when interpreting spectra in exams
-
IR spectroscopy has practical applications including breathalysers for ethanol detection and environmental monitoring of pollutants