Chromatography and Functional Group Analysis (OCR A-Level Chemistry A): Revision Notes
Chromatography and Functional Group Analysis
Introduction to chromatography
Chromatography is an analytical technique used to separate the individual components present in a mixture of substances. This separation method is valuable in many areas of chemistry, including analysis of drugs, plastics, flavourings, air samples, and forensic science.
All chromatographic methods work on the same fundamental principle: they involve two distinct phases that interact with the mixture components in different ways.
The stationary phase is the part of the system that remains fixed in position. This is typically a solid material, or alternatively a liquid that has been supported on a solid surface. The stationary phase does not move during the separation process.
The mobile phase is the part of the system that moves through or over the stationary phase. The mobile phase is usually either a liquid solvent or a gas, and it carries the mixture components along with it.
During chromatography, the different substances in the mixture interact with both phases. Components that interact more strongly with the stationary phase will move more slowly, while those with weaker interactions will be carried further by the mobile phase. This difference in behaviour allows the mixture to be separated into its individual components.
Thin layer chromatography (TLC)
Principles of TLC
Thin layer chromatography is a quick and inexpensive analytical technique that can tell us how many different components are present in a mixture. The method uses a TLC plate, which consists of a flat sheet (usually made of plastic or glass) that has been coated with a thin layer of a solid adsorbent material.
The adsorbent is the substance that holds the different components of the mixture. Silica is the most commonly used adsorbent material in TLC. In this technique, the adsorbent acts as the stationary phase because it remains fixed on the plate.
Adsorption refers to the process by which the solid silica holds the different substances in the mixture on its surface. Different substances have varying degrees of affinity (attraction) for the adsorbent, meaning they bind to the silica surface with different strengths. This variation in binding strength is what enables the separation to occur.
As the mobile phase (a liquid solvent) moves up the plate, it carries the mixture components with it. Components with stronger affinity for the stationary phase travel more slowly, while those with weaker affinity are carried further up the plate. The result is that substances separate into distinct spots at different heights on the plate.
Carrying out TLC
The basic procedure for performing thin layer chromatography involves several key steps:
-
Prepare the TLC plate: Using a pencil (not pen, as ink would interfere), draw a horizontal line approximately 1 cm from the bottom edge of the plate. This is called the base line or sample line.
-
Apply the sample: Using a capillary tube, spot a small amount of the sample solution onto the base line on the plate.
-
Prepare the developing chamber: Set up a chromatography tank, which can be made from a small beaker with a watch glass placed on top. Pour the solvent into the beaker to a depth of about 0.5 cm.
-
Place the plate in the solvent: Carefully position the prepared TLC plate in the beaker, ensuring that the solvent level does not cover the sample spot. Cover the beaker with the watch glass and leave it undisturbed on the bench. The solvent will begin to rise up the TLC plate by capillary action.
-
Allow development: Let the solvent rise up the plate until it reaches approximately 1 cm below the top of the plate. Then remove the plate from the beaker and immediately mark the position of the solvent front (the highest point reached by the solvent) with a pencil. Allow the plate to dry.
-
Visualise the results: If the separated spots are visible, circle them with a pencil. If spots are not visible to the naked eye, you may need to use a locating agent. For example, holding a UV lamp over the plate can reveal spots, or spraying with a chemical such as ninhydrin (which reacts with amino acids) can make them visible.
The solvent depth must be less than 1 cm because if the solvent covers the sample spot at the start, the sample would simply dissolve into the solvent rather than being separated on the plate.
Interpreting TLC plates and calculating Rf values
Once a TLC plate has been developed and the spots visualised, we can identify the components by calculating the retention factor (Rf value) for each spot.
The Rf value is a characteristic number for each substance under specific conditions (same solvent and same adsorbent). It is calculated using the formula:
To use this formula:
- Measure the distance from the base line to the centre of each spot (distance moved by component)
- Measure the distance from the base line to the solvent front (distance moved by solvent front)
- Divide the first measurement by the second
The Rf value will always be a number between 0 and 1, with no units.
Worked example: identifying amino acids
Worked Example: Identifying Amino Acids Using TLC
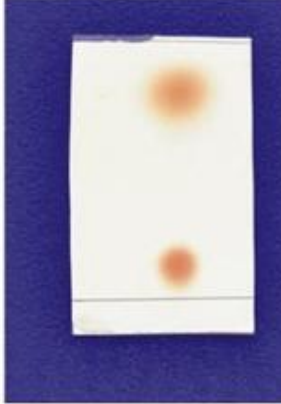
A mixture of amino acids is analysed using TLC. The developed plate shows three coloured spots. The task is to identify which amino acids are present.
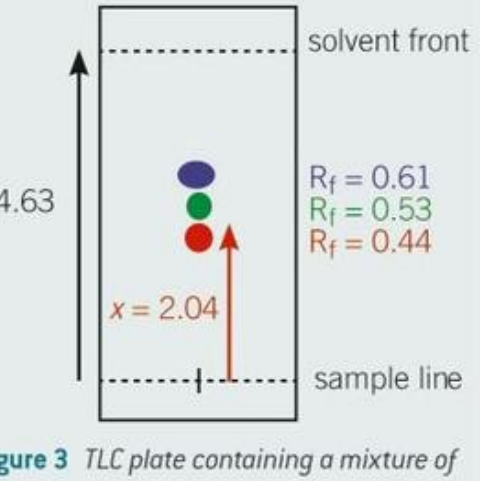
Step 1: Measure the distances on the plate. In this example, the solvent front has travelled 4.63 cm from the base line.
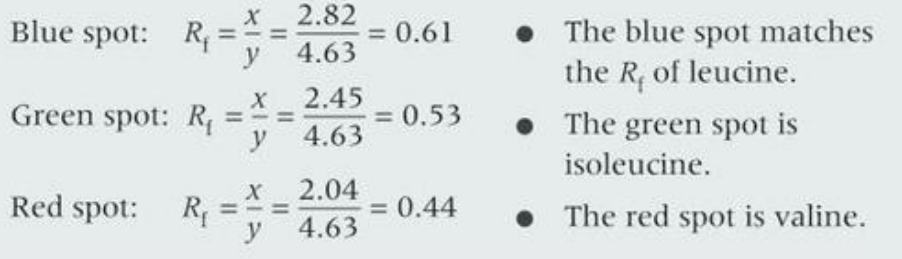
Step 2: Calculate the Rf value for each spot:
Blue spot:
Green spot:
Red spot:
Step 3: Compare these calculated values with known Rf values in a reference table:
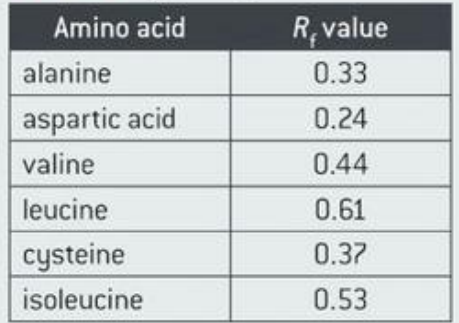
Step 4: Match the values to identify the amino acids:
- Blue spot (Rf = 0.61) matches leucine
- Green spot (Rf = 0.53) matches isoleucine
- Red spot (Rf = 0.44) matches valine
An alternative approach is to run pure samples of suspected components alongside the unknown mixture on the same plate. You can then identify components visually by comparing the positions of spots, without needing to calculate Rf values.
Gas chromatography (GC)
Principles and apparatus
Gas chromatography is an analytical technique particularly useful for separating and identifying volatile organic compounds that are present in a mixture. Unlike TLC, where the mobile phase is a liquid, gas chromatography uses a gas as the mobile phase.
The key components of a gas chromatograph are shown in the diagram below:
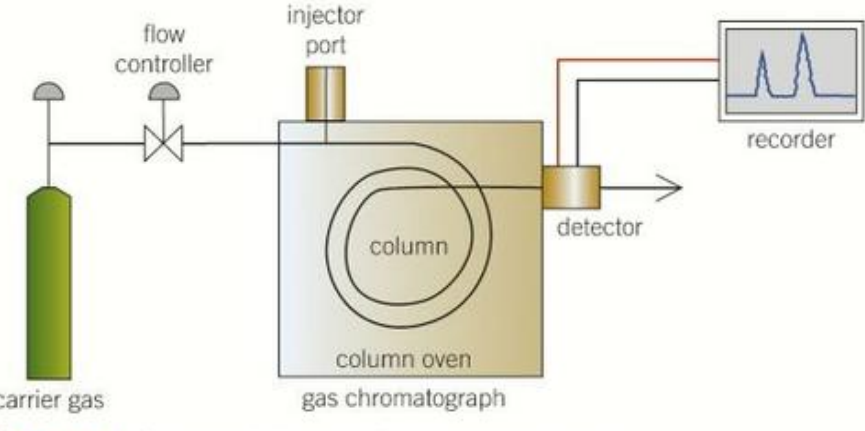
The main parts of the system include:
- A cylinder containing the carrier gas (mobile phase)
- A flow controller to regulate gas flow
- An injector port where the sample is introduced
- A column housed inside a temperature-controlled oven
- A detector at the end of the column
- A recorder that displays the chromatogram
The stationary phase in gas chromatography consists of a high boiling point liquid that has been adsorbed onto an inert solid support. This stationary phase is packed inside a long capillary column.
The mobile phase is an inert carrier gas such as helium or neon. This gas does not react with the sample components but simply carries them through the system.
How gas chromatography works
The separation process in gas chromatography follows these steps:
-
A small amount of the volatile mixture is injected into the gas chromatograph through the injector port.
-
The carrier gas picks up the sample and carries it through the capillary column, which contains the liquid stationary phase adsorbed onto a solid support.
-
As the components travel through the column, they interact with the liquid stationary phase. The key principle is that components slow down as they interact with the stationary phase.
-
Different components have different solubilities in the liquid stationary phase. The more soluble a component is in the stationary phase, the more slowly it moves through the column.
-
The components reach the detector at different times depending on their interactions with the stationary phase. The compound that has the lowest solubility in the stationary phase (and therefore the weakest interaction) will have the shortest retention time and will be detected first.
-
The detector produces signals that are recorded and displayed as peaks on a chromatogram.
The retention time is defined as the time taken for each component to travel through the column from injection to detection. This is a characteristic property of each substance under specific GC conditions and can be used for identification.
Interpreting gas chromatograms
A gas chromatogram provides two important pieces of information about the sample:
1. Identification from retention times
Each peak on the chromatogram represents a different component in the mixture. By comparing the retention times of unknown peaks with the retention times of known compounds (run under the same conditions), we can identify what substances are present in the sample.
The chromatogram below shows the separation of five different drugs detected in a urine sample:
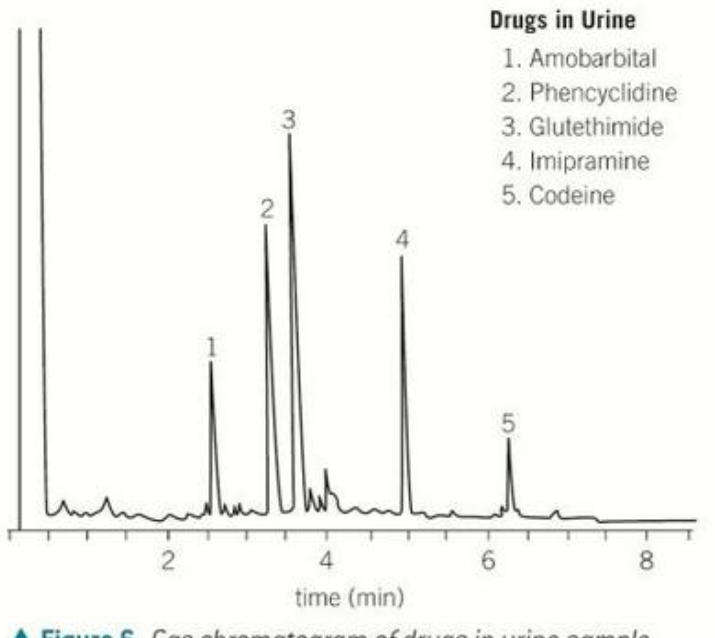
Each numbered peak corresponds to a specific drug, identified by matching its retention time to reference data.
2. Concentration from peak integration
The area under each peak (called peak integration or peak area) is proportional to the concentration of that component in the sample. Larger peak areas indicate higher concentrations of that substance.
To determine the actual concentration of a component, we use a calibration curve method:
Determining concentration using calibration curves
The procedure for quantifying concentrations involves the following steps:
-
Prepare several standard solutions of the compound being investigated, each with a known concentration.
-
Obtain gas chromatograms for each of these standard solutions under identical conditions.
-
Construct a calibration curve by plotting peak area (or relative peak area) on the y-axis against concentration on the x-axis. This is an example of external calibration and provides a method for converting peak area measurements into actual concentration values.
-
Run a gas chromatogram of the unknown sample under the same conditions as used for the standards.
-
Measure the peak area for the compound of interest in the unknown sample, then use the calibration curve to determine its concentration.
Worked Example: Determining Caffeine Concentration
The diagram below illustrates this process for caffeine analysis:
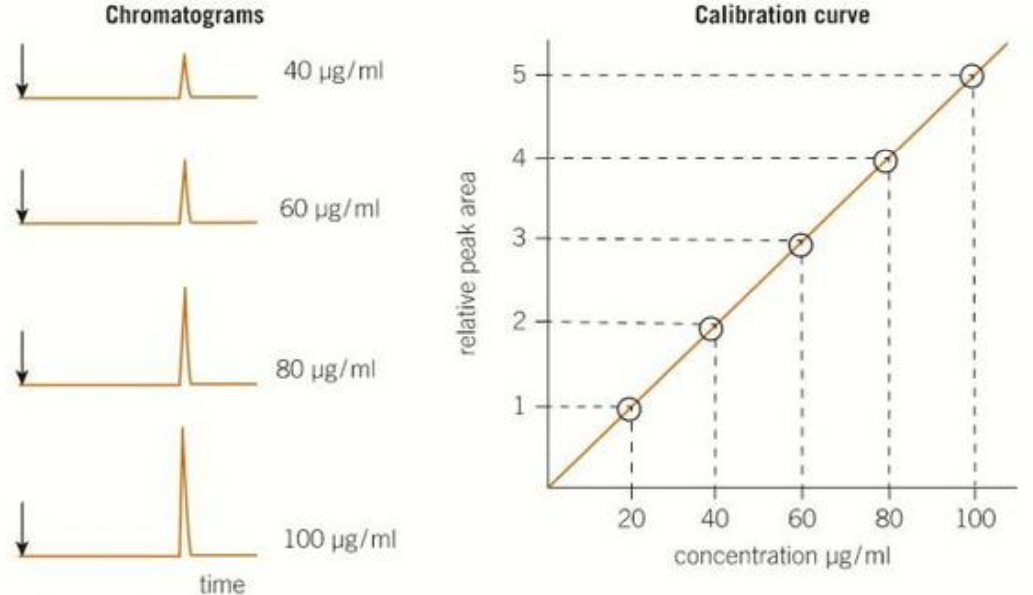
The left panel shows chromatograms for four standard solutions (40, 60, 80, and 100 µg/ml). The right panel shows the resulting calibration curve, which displays a linear relationship between concentration and peak area. This straight-line relationship allows us to determine the concentration of caffeine in an unknown sample by measuring its peak area and reading the corresponding concentration from the graph.
Qualitative analysis of functional groups
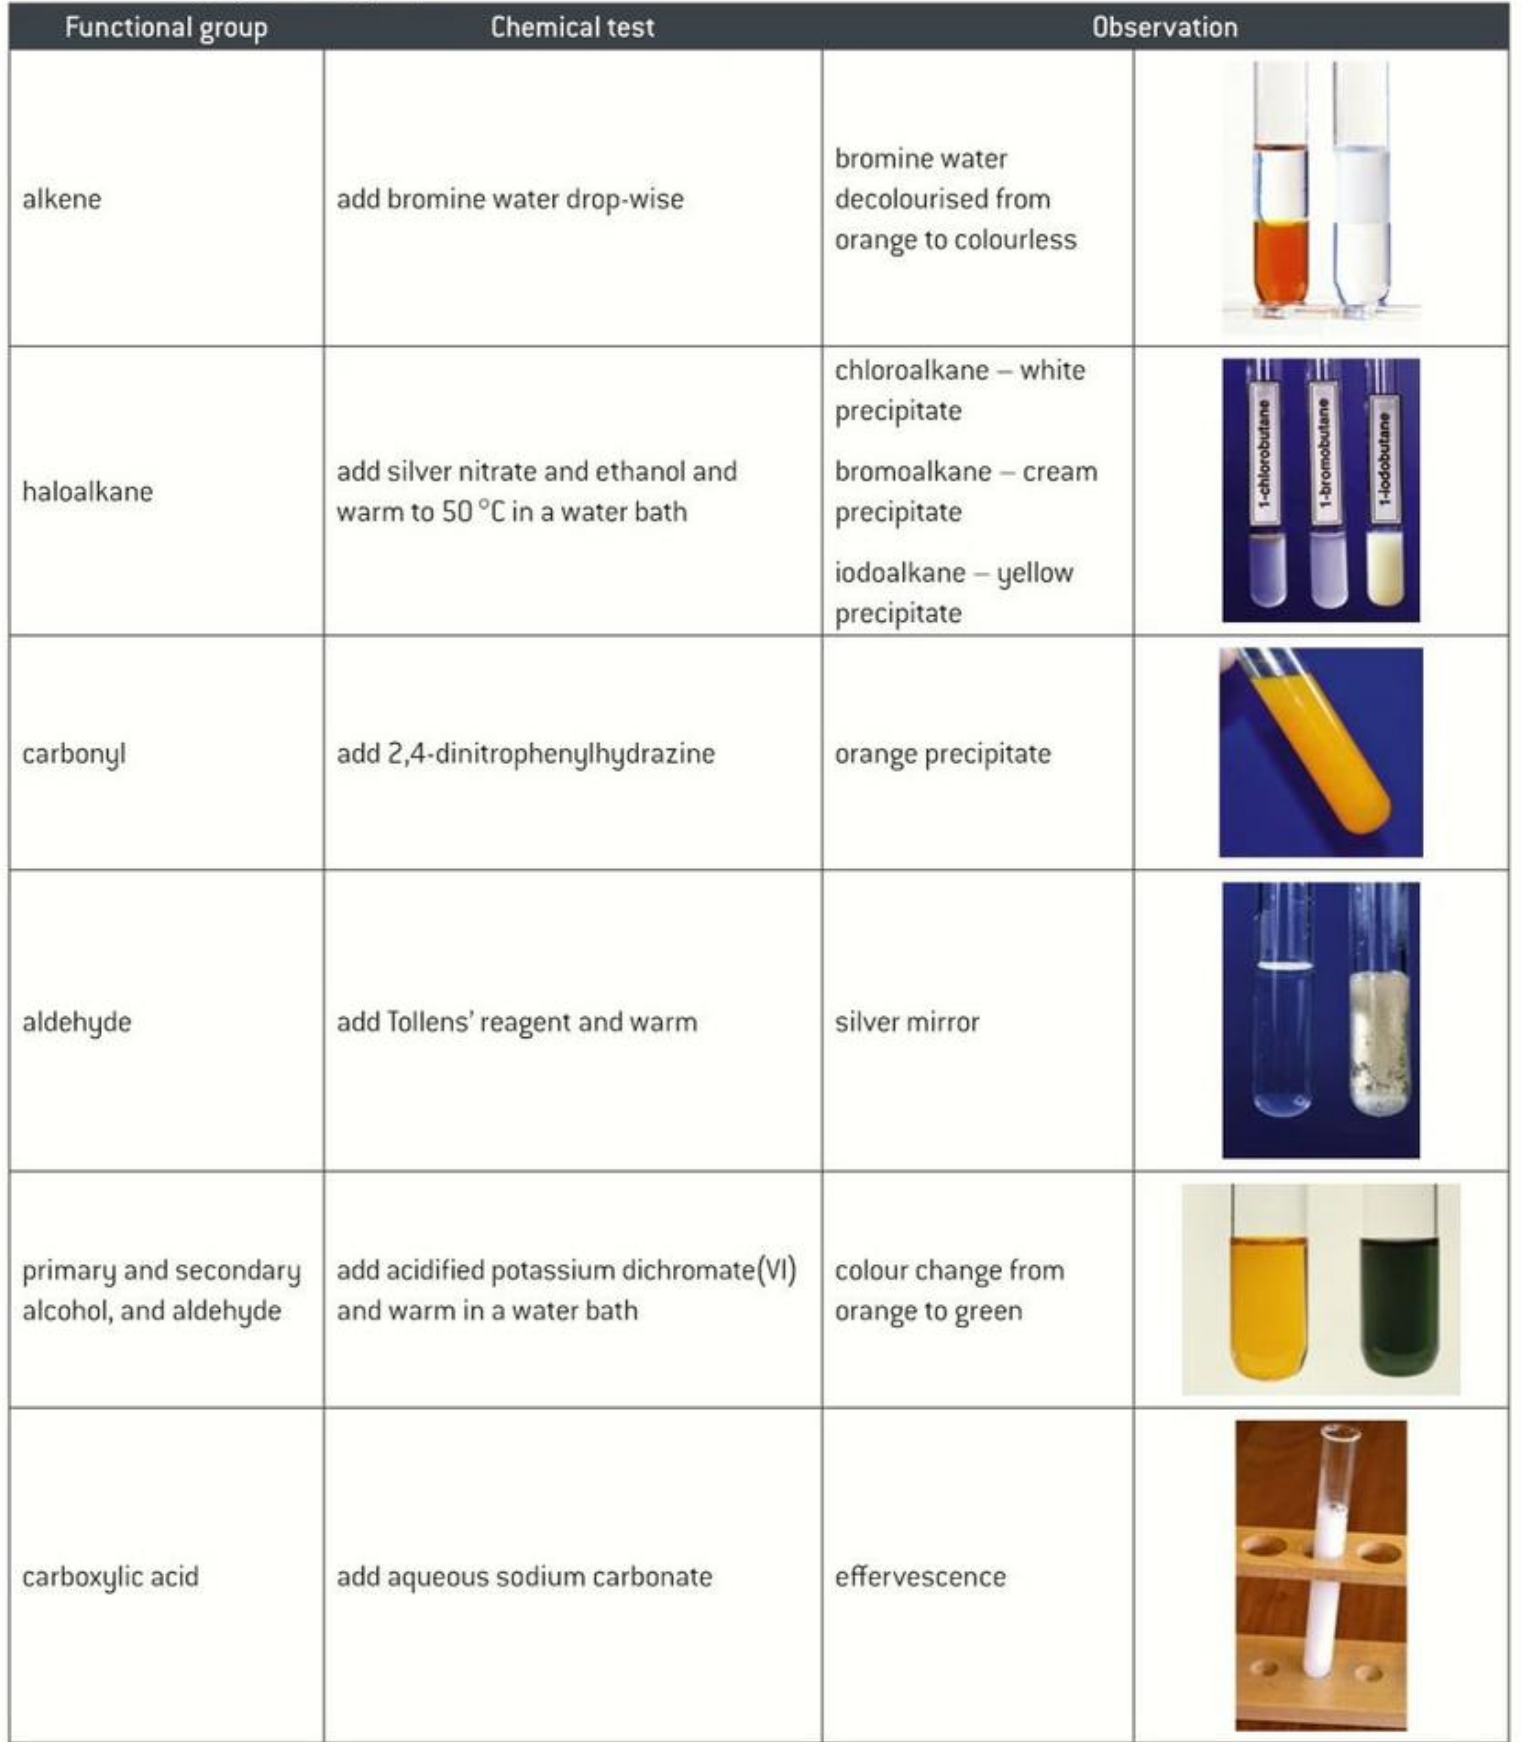
Many functional groups in organic compounds can be identified through simple chemical tests carried out on a test-tube scale. These tests produce observable changes such as colour changes, precipitate formation, or effervescence that indicate the presence of specific functional groups.
Summary of functional group tests
The table below summarises the key tests you need to know for identifying different functional groups:
Let's examine each test in detail:
Test for alkenes
To test for the presence of a carbon-carbon double bond:
- Add bromine water drop-wise to the sample
- Positive result: The orange colour of bromine water is decolourised (becomes colourless)
- This occurs because the alkene undergoes an addition reaction with bromine
Test for haloalkanes
To identify and distinguish between chloro-, bromo-, and iodoalkanes:
- Add silver nitrate solution and ethanol to the sample, then warm to 50°C in a water bath
- Positive results:
- Chloroalkane produces a white precipitate (silver chloride)
- Bromoalkane produces a cream precipitate (silver bromide)
- Iodoalkane produces a yellow precipitate (silver iodide)
The different coloured precipitates allow you to distinguish between the three types of haloalkanes.
Test for carbonyl groups (aldehydes and ketones)
To test for the presence of a carbonyl group (C=O):
- Add 2,4-dinitrophenylhydrazine (2,4-DNPH) reagent to the sample
- Positive result: An orange precipitate forms
- This test is positive for both aldehydes and ketones, so it confirms the presence of a carbonyl group but does not distinguish between them
Test for aldehydes (distinguishing from ketones)
To specifically identify an aldehyde and distinguish it from a ketone:
- Add Tollens' reagent to the sample and warm gently
- Positive result: A silver mirror forms on the inside of the test tube
- This test is positive only for aldehydes, not ketones, because aldehydes are easily oxidised while ketones resist oxidation
Tollens' reagent is the key test for distinguishing aldehydes from ketones. Only aldehydes produce the characteristic silver mirror.
Test for primary/secondary alcohols and aldehydes
To test for compounds that can be oxidised:
- Add acidified potassium dichromate(VI) solution to the sample and warm in a water bath
- Positive result: The colour changes from orange to green
- This indicates oxidation has occurred
- Primary alcohols oxidise to aldehydes (then carboxylic acids)
- Secondary alcohols oxidise to ketones
- Aldehydes oxidise to carboxylic acids
- Note: Tertiary alcohols do not react (remain orange) and ketones do not react
Test for carboxylic acids
To identify a carboxylic acid group:
- Add aqueous sodium carbonate solution to the sample
- Positive result: Effervescence (fizzing) occurs as carbon dioxide gas is produced
- This test is specific to carboxylic acids as they are acidic enough to react with carbonates
Identifying phenols
Phenols are a special class of organic compounds that require additional consideration. Although phenols are acidic compounds, they are considerably weaker acids than carboxylic acids.
Key properties of phenols:
- Phenols can be tested using pH indicator paper to show their acidic nature
- However, phenols are not acidic enough to react with sodium carbonate, so they will not produce effervescence in the carboxylic acid test
- This difference allows us to distinguish phenols from carboxylic acids
Specific test for phenols:
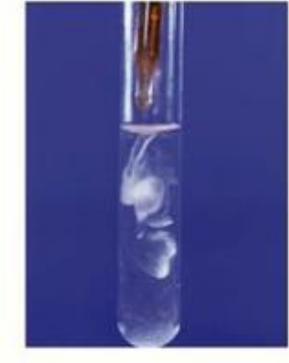
Phenol undergoes an electrophilic substitution reaction with bromine at room temperature. When bromine is added to an aqueous solution of phenol:
- The bromine is decolourised (loses its orange-brown colour)
- A white precipitate forms
This white precipitate is 2,4,6-tribromophenol, formed when three hydrogen atoms on the benzene ring are replaced by bromine atoms.
Important distinction: While both alkenes and phenols decolourise bromine, you can distinguish between them because:
- Alkenes produce no precipitate (just decolourisation)
- Phenols produce a white precipitate along with decolourisation
Key Points to Remember:
-
Chromatography separates mixtures using a stationary phase (which doesn't move) and a mobile phase (which carries components through the system)
-
In TLC, calculate Rf values using: . Compare these values with reference data to identify components. The Rf value is always between 0 and 1.
-
In gas chromatography, retention times identify components (by comparison with standards), while peak areas determine concentrations (using calibration curves). Components with lower solubility in the stationary phase have shorter retention times.
-
Functional group tests produce observable changes: alkenes decolourise bromine water, aldehydes form silver mirrors with Tollens' reagent, carboxylic acids effervesce with sodium carbonate, and phenols form white precipitates with bromine.
-
Common exam mistake: Students often mix up which tests distinguish between similar functional groups (e.g., aldehydes vs ketones, alcohols vs aldehydes, phenols vs alkenes). Always learn the specific observations that distinguish between similar groups.