Demand and Supply (Edexcel A-Level Business): Revision Notes
Factors leading to a change in demand
Understanding demand
Demand refers to the quantity of a product that consumers are both willing and able to purchase at any given price. This is different from what consumers might want to buy – demand focuses on what people can actually afford and would purchase in the market.
The distinction between desire and demand is crucial. A student might want a luxury sports car, but unless they have £50,000 and are willing to spend it, there is no effective demand. Demand requires both willingness and financial ability.
For example, demand for cars in the UK market at an average price of £9,000 might be 130,000 units per year. This represents effective demand, not just desire to own a car.
The demand curve and inverse price-quantity relationship
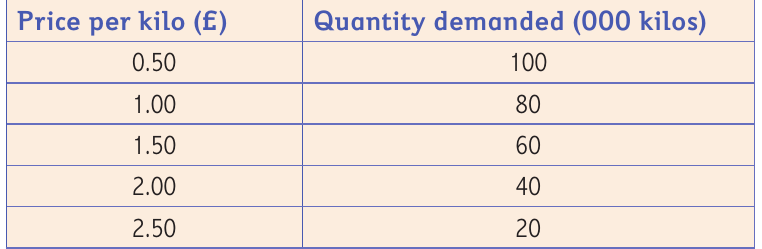
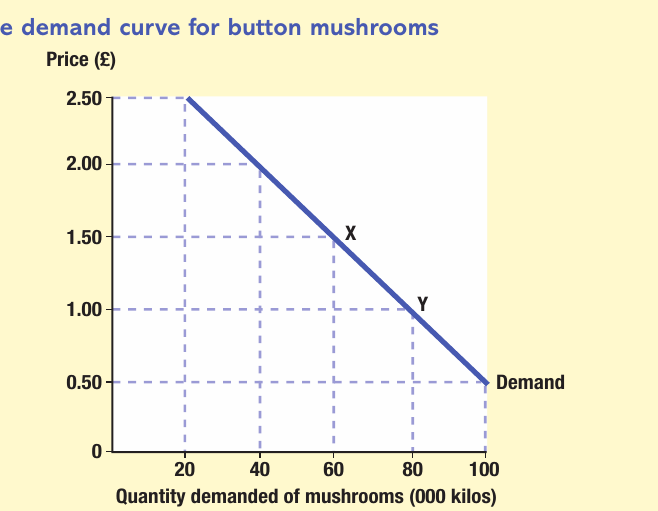
Demand can be illustrated using a demand schedule (a table showing quantities demanded at different prices) and a demand curve (a graph plotting this relationship).
The demand curve slopes downward from left to right, demonstrating an inverse relationship between price and quantity demanded. This means:
- When price increases, quantity demanded falls
- When price decreases, quantity demanded rises
This relationship holds ceteris paribus (assuming all other factors remain constant).
The inverse price-quantity relationship is one of the most fundamental principles in economics. As prices rise, consumers either cannot afford as much or choose to buy less. As prices fall, products become more affordable and attractive, increasing the quantity demanded.
In the button mushroom example above, at £0.50 per kilo, consumers demand 100,000 kilos. At £2.50 per kilo, demand falls to just 20,000 kilos. This inverse relationship is fundamental to understanding market behaviour.
Movement along the demand curve vs shifts in demand
It's crucial to distinguish between two types of changes:
Understanding the Difference: Movements vs Shifts
Many students confuse these two concepts. Remember:
- Movement along = price of the product itself changes, curve stays in place
- Shift in curve = non-price factors change, entire curve moves position
Getting this distinction right is essential for exam success.
Movement along the demand curve occurs when the price of the product itself changes. In the mushroom diagram, a price fall from £1.50 to £1.00 causes a movement from point X to point Y along the curve. This represents an extension in demand (quantity demanded rises from 60,000 to 80,000 kilos). A price rise would cause a contraction in demand. The curve itself does not move.
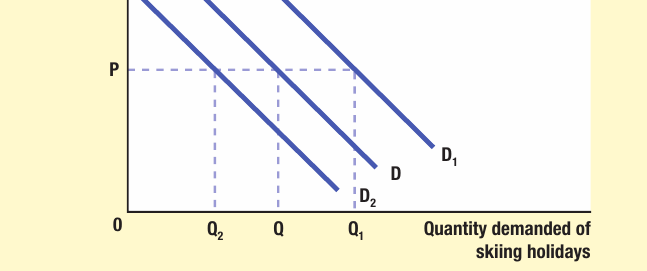
Shifts in the demand curve occur when factors other than price change. These shifts represent a change in demand at every price level. The entire curve moves position – rightward for an increase in demand, leftward for a decrease.
Factors causing shifts in demand
Seven key factors can cause the demand curve to shift, changing demand at all price levels. Understanding these is essential for businesses making strategic decisions.
1. Prices of substitute goods
Substitute goods are products that can replace each other in consumption because they satisfy similar needs or wants. For example, Coca-Cola and Pepsi-Cola are close substitutes, as are different brands of mobile phones or supermarket own-label products versus branded items.
How substitutes affect demand:
The relationship works in opposite directions:
- If the price of a substitute falls, consumers switch to the cheaper alternative, reducing demand for the original product (leftward shift from D to D₂)
- If the price of a substitute rises, demand for the original product increases as consumers switch away from the now-more-expensive alternative (rightward shift from D to D₁)
The closer the substitutes, the greater the impact of price changes.
For instance, if the price of winter sun holidays decreases, demand for skiing holidays would fall as consumers opt for the cheaper beach alternative instead.
2. Prices of complementary goods
Complementary goods are products consumed together – they are used in combination. Classic examples include:
- Cornflakes and milk
- Cars and car insurance
- Smartphones and mobile phone contracts
- Skis and skiing accessories
How complements affect demand:
The relationship works in the same direction:
- If the price of a complement falls, demand for the original product increases (rightward shift from D to D₁)
- If the price of a complement rises, demand for the original product decreases (leftward shift from D to D₂)
For example, a reduction in the price of skiing accessories (boots, poles, clothing) may encourage more people to take up skiing, increasing demand for skiing holidays. Similarly, falling prices for gaming consoles would likely increase demand for video games.
3. Changes in consumer incomes
The relationship between income and demand depends on the type of good:
Normal Goods vs Inferior Goods
This distinction is crucial for understanding how demand responds to economic conditions:
Normal goods: Demand increases when incomes rise Inferior goods: Demand decreases when incomes rise
Don't assume all goods behave the same way when consumer wealth changes!
Normal goods are products for which demand increases when consumer incomes rise. Most goods and services fall into this category. Examples include:
- Restaurant meals and dining out
- New cars
- Holiday travel
- Consumer electronics
- Designer clothing
When wages and salaries increase, consumers have greater purchasing power and typically demand more normal goods. During economic growth periods, demand for these products rises (rightward shift).
Inferior goods are products for which demand actually falls when incomes rise. These are typically lower-quality alternatives that consumers move away from as they become wealthier. Examples include:
- Supermarket own-label/value ranges (e.g., basic canned goods)
- Public transport (consumers may switch to private cars)
- Budget accommodation
- Second-hand goods
Worked Example: Income Changes and Product Type
Consider a consumer who currently buys Morrison's own-label baked beans at £0.40 per tin.
Scenario 1 - Income rises by 20%: The consumer now has more disposable income and switches to Heinz branded beans at £0.80 per tin. The own-label beans are revealed to be an inferior good – demand for them has fallen as income rose.
Scenario 2 - Economic recession reduces income by 15%: A different consumer who was buying Heinz beans must now economize and switches to Morrison's own-label beans to save money. During downturns, demand for inferior goods often increases as consumers trade down.
For skiing holidays (typically a normal good), rising consumer incomes would shift demand from D to D₁, while falling incomes during a recession would shift demand from D to D₂.
4. Fashions, tastes and preferences
Consumer tastes and preferences constantly evolve, significantly impacting demand patterns. Changes can be driven by:
Fashion trends: The clothing industry experiences rapid changes in demand as styles go in and out of fashion. Items popular in one season may be unwanted the next, causing sharp shifts in demand curves.
Celebrity influence and cultural trends: The rise in UK cycling demand since 2005 demonstrates this effect. Bradley Wiggins' Tour de France success and British Olympic cycling achievements sparked increased interest in the sport.
Worked Example: Taste Changes and Cycling Demand
Initial situation (pre-2005): UK cycling participation was relatively stable with modest demand for bicycles.
Catalyst events:
- Bradley Wiggins' Tour de France victory
- British Olympic cycling success
- Growing health consciousness
Result: By 2013, 50 million bicycle journeys were made in the UK, up 7% on the previous year. This taste change shifted the demand curve for bicycles rightward, increasing demand at every price level.
Lifestyle changes: Growing demand for 4x4 vehicles in the UK occurred not because more people needed off-road capability, but because consumer preferences shifted toward finding these vehicles appealing and desirable.
Health consciousness: Increased awareness of healthy eating has boosted demand for organic foods, fresh vegetables, and low-sugar products, while reducing demand for processed foods high in fat and sugar.
When fashions or preferences change favourably toward a product, the demand curve shifts from D to D₁. Negative changes shift demand from D to D₂.
5. Advertising and branding
Businesses invest heavily in advertising and branding specifically to shift demand curves rightward and increase sales at all price points.
Worked Example: UK Advertising Expenditure (2013)
Top advertisers by spending:
- Sky: Over £264 million – leading UK advertiser
- Procter & Gamble: £177 million (£87 million less than Sky)
- DFS: £75 million at number 10
Analysis: This substantial investment aims to increase product awareness and demand. The £189 million range between the top and 10th advertiser demonstrates how competitive firms view advertising as essential for shifting demand curves rightward.
How advertising works: Effective advertising campaigns:
- Increase product awareness among potential customers
- Create positive associations and emotional connections with brands
- Differentiate products from competitors
- Remind existing customers to repurchase
Branding Strategy
Strong brands can command premium prices and higher demand by:
- Creating distinctive names, symbols, logos and packaging that distinguish products from competitors
- Building brand recognition and loyalty through consistent messaging
- Developing positive brand associations through positioning, promotion and advertising
- Establishing emotional connections with consumers
Successful advertising and branding campaigns shift the demand curve from D to D₁, allowing businesses to sell more units at each price level. For skiing holidays, increased marketing spending would likely shift demand rightward.
6. Demographics
Demographics refers to the characteristics of a population, including its size and structure. As population composition changes, so do patterns of demand.
Population size: As the overall population grows, demand for nearly all goods and services increases. More people means more potential consumers, shifting demand curves rightward for most products.
However, the structure of the population matters just as much as its size:
Age Distribution
Age distribution measures the numbers of people in different age groups:
- Many countries have experienced growth in the over-60 age group, increasing demand for retirement homes, specialist elderly holidays, and healthcare services
- A growing 18-40 age group would increase demand for products like skiing holidays, shifting the curve from D to D₁
- Young families create demand for childcare, children's clothing, and educational services
- As populations age, demand patterns shift toward products and services for older consumers
Gender distribution affects demand patterns:
- In the UK, there are slightly more women than men overall
- In older age groups, the female-to-male ratio increases further
- This creates greater demand for women's clothing than men's clothing
- Gender-specific products see demand influenced by population gender balance
Geographical distribution impacts where demand occurs:
- Urban areas have higher concentrations of people than rural areas
- This increases demand for schools, hospitals, housing, and transport in cities
- Rural areas see lower demand for many services due to lower population density
- Businesses must consider location when assessing demand
Ethnic Groups and Cultural Demand
Ethnic groups within populations create demand for culture-specific products:
- Since 2005, Eastern European migration to the UK increased as more countries joined the EU
- This created demand for specialist retail outlets, such as Polish food shops
- As ethnic groups grow, demand for products associated with their culture increases
- This represents new market opportunities for businesses
Household structure affects demand for certain products:
- Growth in single-person households increases demand for smaller accommodation units (studios, one-bedroom flats)
- Larger family households create demand for family-sized cars, bigger properties, and bulk shopping
- Changes in household composition shift demand curves for housing, furniture, and household goods
Changes in demographics that favour a product shift demand from D to D₁, while unfavourable changes shift demand from D to D₂.
7. External shocks
External shocks are factors beyond businesses' direct control that can significantly impact demand. These unpredictable events can cause sudden shifts in demand curves.
Competition as an External Shock
Entry of strong new competitors typically reduces demand for existing firms' products:
- When BT won rights to broadcast Barclays Premier League football in 2014, demand for Sky's sports packages faced potential decline
- New competitors offering similar products at lower prices shift demand away from established providers
- Innovative competitors introducing superior products can dramatically reduce demand for existing alternatives
- Market entry shifts the demand curve from D to D₂ for existing firms
Government action: Government policies and legislation influence demand in multiple ways:
- Tax changes: Raising income taxes reduces consumers' spending power, dampening demand for many products (leftward shift)
- Regulation: New laws designed to increase competition in gas and electricity markets might reduce demand for existing operators as consumers switch to new entrants
- Subsidies: Government subsidies for electric vehicles increase demand by effectively lowering the price to consumers
- Legal restrictions: Bans or restrictions on certain products (e.g., single-use plastics) reduce their demand to zero
Economic climate: The overall state of the economy significantly affects demand:
- Economic growth: When GDP rises, employment increases and wages grow, boosting demand for most goods and services (rightward shift from D to D₁)
- Recession: Economic downturns reduce employment and incomes, decreasing demand especially for non-essential goods like skiing holidays (leftward shift from D to D₂)
- Consumer confidence: Even expectations of future economic conditions affect current demand – pessimistic consumers reduce spending in anticipation of harder times ahead
Social and Environmental Factors
Changing societal attitudes and concerns reshape demand patterns:
- Social media growth: Massive increase in demand for social networking platforms has driven demand for smartphones, tablets, apps, and mobile data services
- Environmental awareness: Growing concerns about global warming and carbon emissions have significantly increased demand for electric cars and hybrid vehicles, while reducing demand for high-emission vehicles
- Health trends: Increased focus on health and fitness has boosted demand for gym memberships, sportswear, and healthy food products
- Work-from-home trends: Remote working patterns increase demand for home office equipment and video conferencing software
External shocks can shift demand either direction depending on their nature – positive shocks shift from D to D₁, while negative shocks shift from D to D₂.
8. Seasonality
Seasonal demand refers to predictable fluctuations in demand at particular times of the year. Unlike other factors, seasonality creates temporary, recurring shifts in demand.
Weather-driven seasonality:
- Demand for garden furniture rises in late spring as weather improves in the UK
- Warm clothing (overcoats, woolly jumpers) sees increased demand in late autumn when temperatures drop
- Ice cream and cold drinks experience summer demand peaks
- Heating fuel demand rises sharply during winter months
Worked Example: Calendar Events Driving Seasonal Demand
Christmas Period: Creates massive demand spikes for:
- Toys and games
- Christmas decorations
- Greeting cards
- Luxury food items (chocolates, champagne, specialty foods)
Valentine's Day: Drives demand surges for:
- Roses – prices can increase by 200-300% in early February
- Chocolates and romantic gifts
- Restaurant reservations
Back to School (September): Increased demand for:
- Stationery and school supplies
- School uniforms
- Books and educational materials
Business Impact: Retailers must anticipate these predictable, recurring shifts to manage stock levels, staffing, and pricing strategies effectively.
Industry-specific seasons:
- Fashion industry: Has distinct buying seasons – items purchased in one season typically won't be in demand later due to changing fashions
- Tourism: Holiday destinations experience peak and off-peak seasons based on weather and school holidays
- Agriculture: Fresh produce has harvest seasons affecting supply and demand
- Sports equipment: Demand for skiing equipment peaks before winter, while demand for cricket gear rises in spring
Managing Seasonal Demand
Businesses must anticipate these seasonal shifts to manage:
- Stock levels (avoiding overstocking or understocking)
- Staffing (hiring seasonal workers during peaks)
- Production schedules (building inventory before demand surges)
- Pricing strategies (potentially charging premium prices during peak seasons)
Seasonal increases shift demand temporarily from D to D₁, while seasonal decreases shift from D to D₂. These are predictable, recurring shifts that businesses can plan for, unlike unpredictable external shocks.
Remember!
Key Points to Remember:
- Demand is the quantity consumers are willing and able to buy at any given price, not just what they want
- The demand curve slopes downward, showing the inverse relationship between price and quantity demanded (ceteris paribus)
- Price changes cause movements along the demand curve (extensions or contractions), not shifts
- Seven non-price factors shift the entire demand curve: substitutes' prices, complements' prices, consumer incomes, tastes/fashion, advertising/branding, demographics, external shocks, and seasonality
- Rightward shifts (D to D₁) represent increased demand at all prices; leftward shifts (D to D₂) represent decreased demand
- Normal goods see rising demand when incomes rise; inferior goods see falling demand when incomes rise
- Demographics include age distribution, gender distribution, geographical distribution, ethnic groups, and household structure – all affecting demand patterns
Key Terms:
- Demand curve – graphical representation of the relationship between price and quantity demanded
- Ceteris paribus – Latin phrase meaning "all other things being equal/constant"
- Substitutes – goods that can replace each other (e.g., Coca-Cola and Pepsi)
- Complements – goods used together (e.g., cars and car insurance)
- Normal goods – products with rising demand when incomes rise
- Inferior goods – products with falling demand when incomes rise
- Demographics – characteristics of a population including size and structure
- External shocks – unpredictable factors beyond business control affecting demand
- Seasonality – predictable recurring changes in demand at particular times of year
Critical Framework:
The seven factors shifting demand: Substitutes, Complements, Incomes, Tastes/fashion, Advertising, Demographics, External shocks, Seasonality (SCITADES)