Interaction of Supply and Demand (Edexcel A-Level Business): Revision Notes
Interaction of supply and demand
Understanding equilibrium price
In any market, price is determined by the interaction of supply and demand. The equilibrium price is where the wishes of consumers match exactly with those of producers. At this price, the quantity demanded equals the quantity supplied.
The equilibrium price is also called the market clearing price. This means the amount supplied in the market is completely bought up by consumers. There are no buyers left without goods and no sellers left with unsold stock. The market clears completely.
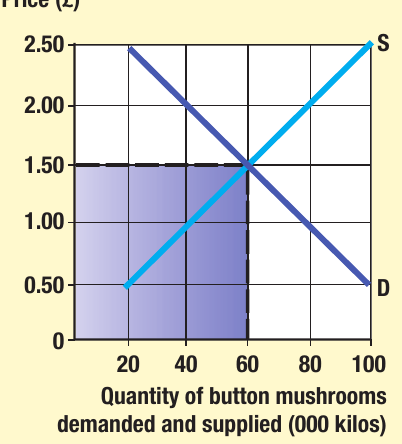
In the diagram above, the equilibrium price for button mushrooms is £1.50. At this price, consumers want to buy 60,000 kilos and producers want to sell 60,000 kilos. At any other price, the market would not clear.
For example, if the price were £2.00, sellers would want to supply 80,000 kilos, but buyers would only demand 40,000 kilos because the price is too high. This creates disequilibrium.
Calculating total revenue
Total revenue (TR) is the amount of money generated from the sale of output. It is calculated by multiplying price and quantity.
Worked Example: Calculating Total Revenue
Using the button mushrooms example, at the equilibrium price of £1.50:
Exam tip: When calculating total revenue, always show your working clearly. Identify the equilibrium price and quantity first, then apply the formula.
Changes in demand and equilibrium price
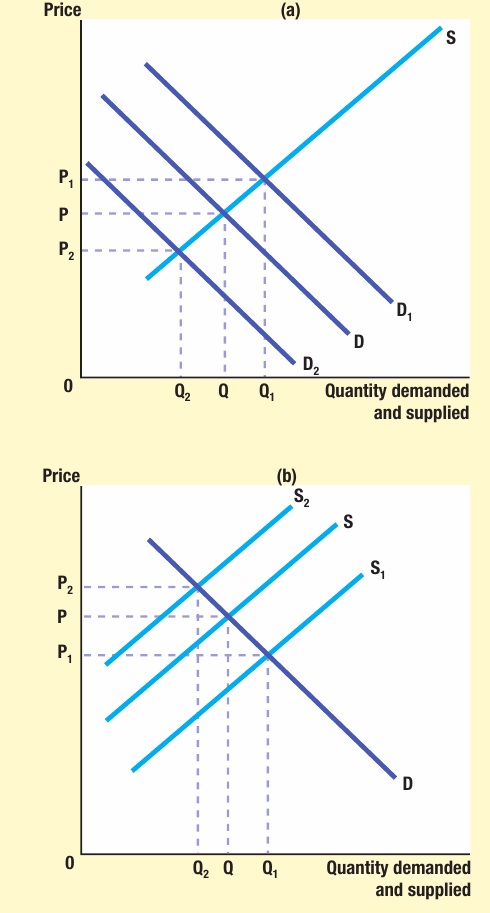
When demand changes, the demand curve shifts and this creates a new equilibrium price and quantity.
When demand increases
If demand increases, the demand curve shifts to the right. This happens when:
- Consumer incomes rise
- The product becomes more fashionable
- Advertising is successful
- Complementary goods become cheaper
When demand increases, producers react by raising their prices. They can do this because customers are wanting the product in higher numbers. The equilibrium price rises and the quantity traded increases.
When demand decreases
If demand decreases, the demand curve shifts to the left. This happens when:
- Consumer incomes fall
- The product goes out of fashion
- Bad publicity damages reputation
- Substitute goods become cheaper
When demand falls, producers are forced to lower their prices. Otherwise they would be left with too much unsold stock. The equilibrium price falls and the quantity traded decreases.
Case study - Gas-fired BBQs: In 2014, the UK enjoyed one of the warmest and sunniest summers on record. Demand for summer-related products like gas-fired BBQs soared. The demand curve shifted right, pushing up both the equilibrium price and quantity sold.
Changes in supply and equilibrium price
When supply changes, the supply curve shifts and this creates a new equilibrium price and quantity.
When supply increases
If supply increases, the supply curve shifts to the right. This happens when:
- Production costs fall (e.g. cheaper raw materials)
- New technology improves efficiency
- More firms enter the market
- Government subsidies are introduced
When supply increases, the equilibrium price falls because there is more available in the market. However, the quantity traded increases.
When supply decreases
If supply decreases, the supply curve shifts to the left. This happens when:
- Production costs rise (e.g. higher wages)
- Bad weather damages crops
- Firms leave the market
- Government taxes increase
When supply falls, the equilibrium price rises because goods become scarcer. The quantity traded decreases.
Worked Example: Accommodation Market
Figure 5 shows the market for accommodation in a UK city. The equilibrium price per room is currently £60. If new hotels open up, this increases the supply of rooms available. The supply curve shifts right from S to S₁.
As a result:
- The equilibrium price per room is forced down from £60 to £40
- The equilibrium number of rooms let rises from 20,000 to 25,000
Changes in both supply and demand
It is possible for both supply and demand to change at the same time in a market. For example, demand might increase while supply decreases simultaneously.
When both curves shift:
- The original equilibrium is where S = D
- After both shifts, the new equilibrium is where S₁ = D₁
- The final effect on price and quantity depends on the relative size of each shift
Important: When both supply and demand change together, you cannot predict the exact outcome for both price and quantity unless you know precisely how much each curve shifts. However, you can make predictions about one variable:
- If demand increases more than supply decreases → quantity rises
- If supply decreases more than demand increases → quantity falls
Exam tip: In evaluation questions about combined shifts, explain that "the final impact on price/quantity depends on the relative magnitude of the shifts." This shows analytical awareness.
Disequilibrium in the market
If the price in a market is not set at the equilibrium point, there will be disequilibrium. This means supply and demand are not equal. Two situations can occur.
Excess demand (shortage)
Excess demand occurs when the price charged is below the equilibrium price. At this lower price:
- Quantity demanded exceeds quantity supplied
- There is a shortage of goods in the market
- Consumers cannot buy as much as they want
Worked Example: Calculating Excess Demand
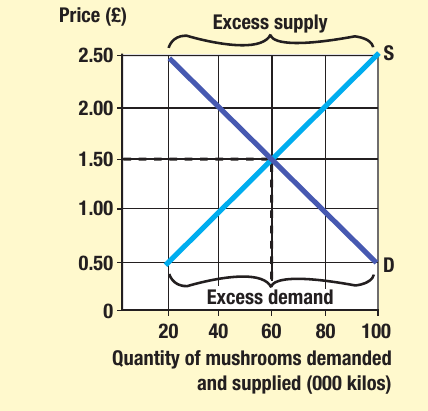
In the diagram, if button mushrooms are priced at £0.50 (below equilibrium of £1.50):
- Demand is 100,000 kilos
- Supply is only 20,000 kilos
- Excess demand = 80,000 kilos (100,000 – 20,000)
Real-world example: Rationing occurs when governments try to keep prices artificially low during shortages. This creates excess demand as consumers want more than is available.
Excess supply (surplus)
Excess supply occurs when the price charged is above the equilibrium price. At this higher price:
- Quantity supplied exceeds quantity demanded
- Goods remain unsold
- Producers have unwanted stock
Worked Example: Calculating Excess Supply
In the diagram, if button mushrooms are priced at £2.50 (above equilibrium of £1.50):
- Supply is 100,000 kilos
- Demand is only 20,000 kilos
- Excess supply = 80,000 kilos (100,000 – 20,000)
Business insight: Firms experiencing excess supply must either cut prices to clear stock or reduce production levels. Holding excess stock ties up working capital and increases storage costs.
Case study: FA Cup Final tickets
Every year, the FA Cup Final is played at Wembley Stadium. The English FA sets ticket prices at what they consider "reasonable" levels (around £60) to ensure genuine football supporters can afford to attend. However, at this price there is always excess demand.
Evidence of the shortage appears in the black market, where tickets are illegally sold by touts at much higher prices—sometimes £500 or more for a £60 ticket.
Why does this happen?
- Wembley's capacity is fixed at 90,000 seats (vertical supply curve)
- The FA sets prices below the equilibrium price
- At £60, far more people want tickets than are available
- The true equilibrium price might be £100 or higher
This creates excess demand of tens of thousands of tickets, explaining why touts can charge such high prices.
Exam application: This case study demonstrates how price controls below equilibrium create persistent shortages and incentivize illegal markets.
Summary of key concepts
| Concept | Definition | Effect on price | Effect on quantity |
|---|---|---|---|
| Demand increases | Demand curve shifts right | Rises | Rises |
| Demand decreases | Demand curve shifts left | Falls | Falls |
| Supply increases | Supply curve shifts right | Falls | Rises |
| Supply decreases | Supply curve shifts left | Rises | Falls |
| Excess demand | Price below equilibrium | Shortage occurs | Qd > Qs |
| Excess supply | Price above equilibrium | Surplus occurs | Qs > Qd |
Key Points to Remember:
- Equilibrium price occurs where supply equals demand—the market clears with no shortages or surpluses
- Total Revenue = Price × Quantity at any point on the demand curve, but particularly important at equilibrium
- When demand increases (shifts right), both price and quantity rise; when demand decreases (shifts left), both fall
- When supply increases (shifts right), price falls but quantity rises; when supply decreases (shifts left), price rises but quantity falls
- Excess demand (shortage) occurs when price is set below equilibrium—quantity demanded exceeds quantity supplied
- Excess supply (surplus) occurs when price is set above equilibrium—quantity supplied exceeds quantity demanded
Key Terms:
- Equilibrium price – the price where supply equals demand
- Market clearing price – the price at which all goods are sold with no surplus or shortage
- Total revenue – the amount of money generated from sales (P × Q)
- Disequilibrium – when supply and demand are not equal
- Excess demand – when quantity demanded exceeds quantity supplied (shortage)
- Excess supply – when quantity supplied exceeds quantity demanded (surplus)
Essential Formula: