Distance- time graphs (Edexcel GCSE Physics): Revision Notes
📚 Revision Notes
Distance-time graphs
infoNote
Distance-time graphs show how far an object travels over a certain period of time.
- The x-axis always represents time in seconds (s).
- The y-axis represents distance in metres (m).
infoNote
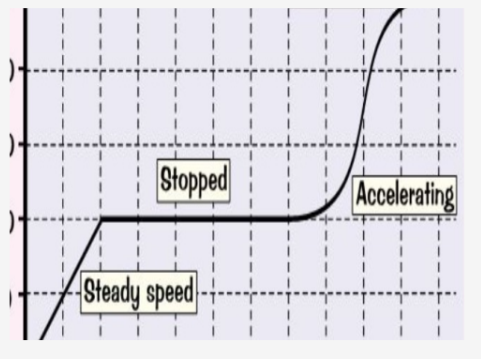
Characteristics of Distance-Time Graphs Summary.
- Steeper line = faster speed
- Flat line = stationary object (gradient is 0)
- Steepening curve = acceleration
- Flattening curve = deceleration
Gradient (Slope)
The gradient of the line on a distance-time graph tells us the speed of the object. The steeper the line, the faster the object is moving.
infoNote
To calculate the gradient and find the speed at different points:
Where:
- ΔD is the change in distance,
- ΔT is the change in time. The delta symbol (Δ) means change, so in this case, it's the change in distance divided by the change in time.